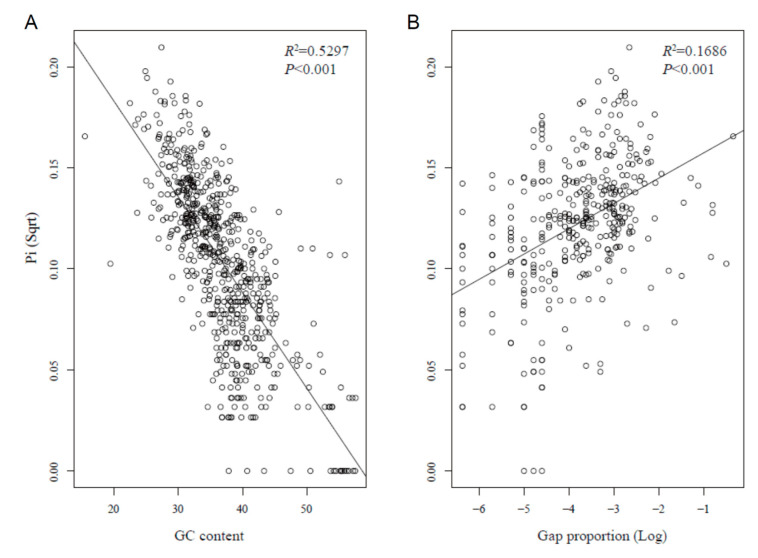
Figure 4.
GC content and gap proportion are correlated with Pi. (A) Scatter plot showing a significant negative correlation (p < 0.001) between GC content and Pi (Sqrt). (B) Scatter plot showing a significant positive correlation (p < 0.001) between gap (indels) proportion and Pi (Sqrt) in the five Pogostemon chloroplast genomes. All three features were measured using 600 bp windows and a 200 bp step size.

