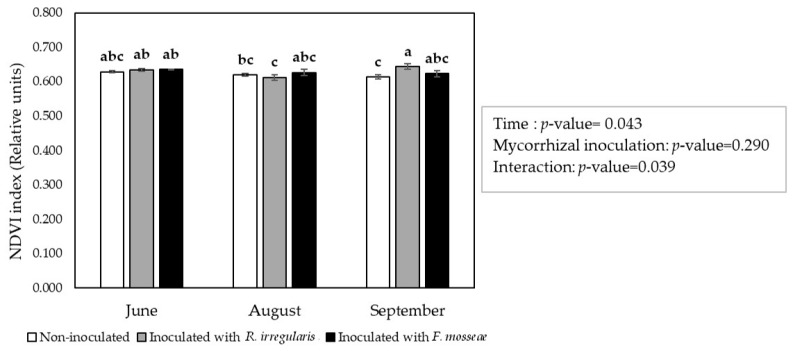
Figure 2.
Normalized difference vegetation index in ‘Touriga Nacional’ variety vine plants grafted onto 1103 Paulsen rootstock measured along the first growing season. Bars indicate the average value (n = 5) ± standard error. Different letters indicate significant differences in group means according to pairwise multiple comparisons conducted using the simulation method of Edwards and Berry [70]. Values within the box indicate the p-value for the significance of the main factors and their interaction. Significant effect, p-value < 0.05.

