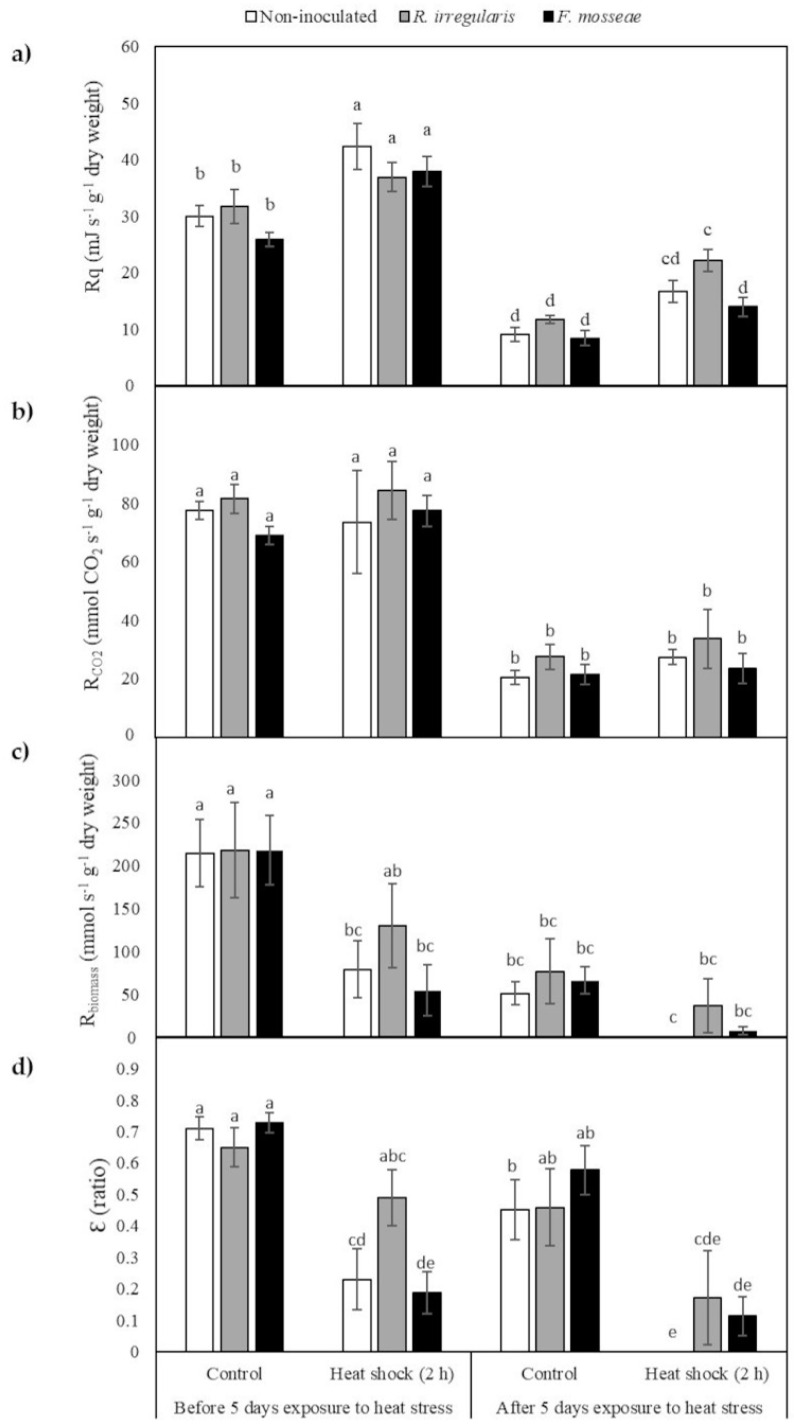
Figure 5.
Calorespirometric parameters. (a) Metabolic heat rate, Rq; (b) CO2 production rate, Rco2; (c) Structural biomass formation rate, Rbiomass; (d) Carbon use efficiency, Ɛ. Bars represent the average of five samples ± standard error. Different letters indicate significant differences according to pairwise multiple comparisons conducted using the simulation method of Edwards and Berry [70]. Significant effect, p-value < 0.05.

