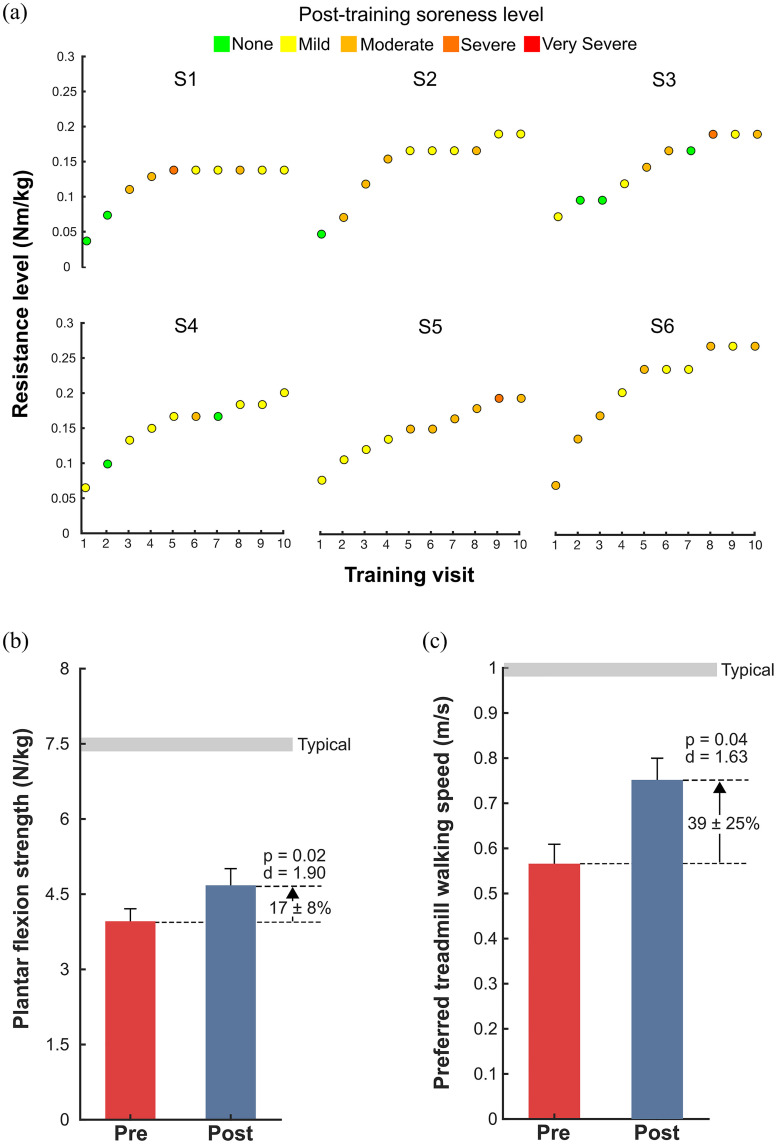
Figure 2.
Training progression, strength and speed outcomes: a) Training progression with indication of the resistance level (Nm/kg) for each of the ten training visits (v2 – v11) and the resulting soreness level from each session: None (green), Mild (yellow), Moderate (light orange), Severe (dark orange), and Very Severe (red); b) Maximum voluntary contraction values for the plantar flexors, presented as the average between both limbs and normalized to body mass; c) Preferred walking speed (m/s) on the treadmill.

