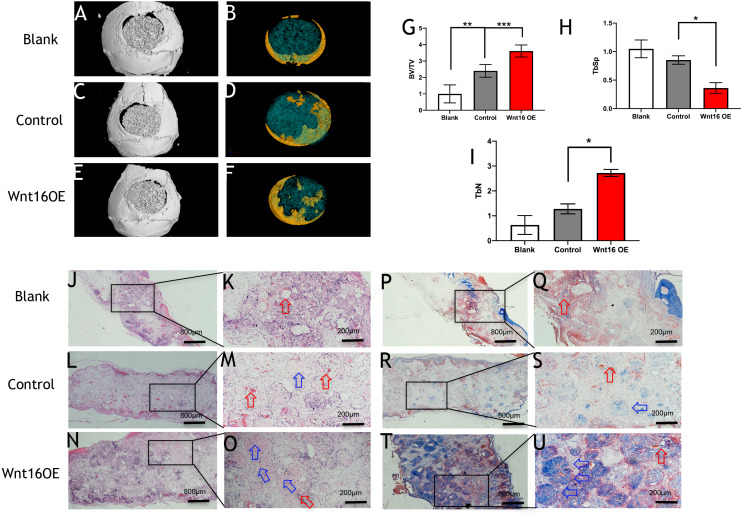
Figure 2. Wnt16 enhanced mineralized tissue formation in vivo by PDCs/ β-TCP implantation.
(A–F) Representative micro-CT images of bone formation. Yellow stands for newly formed bone like tissue. (G–I) Quantitative analysis of trabecular bone volume (BV)/scaffold tissue volume (TV) ratio, trabecular space (Tb.Sp), trabecular number (Tb.N). (J–Q, P–U) Histological analysis of bone formation at 8 weeks after implantation: H & E staining (J–Q); Masson’s trichrome stainings (P–U). (J, L, N, P, R, T) Magnification × 100; (K, M, O, Q, S, U) Magnification × 400; Red arrow: blood vessel; Blue arrow: mineralized matrix. Scale bar: 200 µm. * p < 0.05, ** p < 0.001, *** p < 0.0001.

