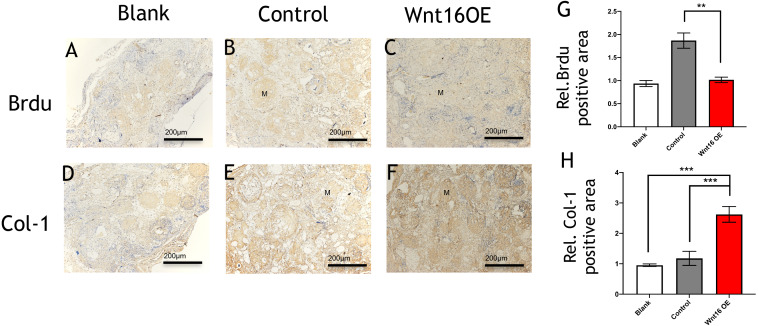
Figure 3. Immunohistological staining of MSCs and osteogenesis marker proteins in calvarial defects at 8 weeks after surgery.
(A–C) Brdu production in mouse calvarial defects. (G) Brdu expression was significantly lower than the control group (n = 3). (D–F) Col-1production in mouse calvarial defects. (H) Col-1 expression was significantly higher than the control group (n = 3). OE, over-expressed; m, matrix, Scale bar: 200 µm. * p < 0.05.

