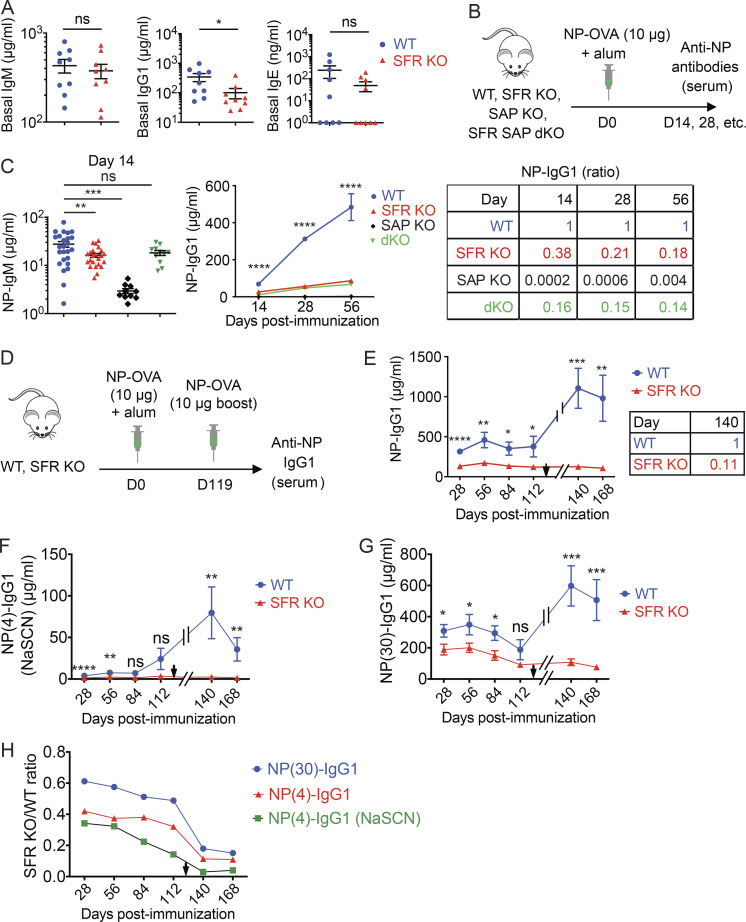
Figure 2.
SFRs are required for antibody production. (A) Baseline IgM, IgG1, and IgE in nonimmunized WT littermate (n = 9) or SFRs KO (n = 9) mice (14–20 wk old) were measured by ELISA. Results are from one experiment. (B and C) WT (n = 25), SFR KO (n = 23), SAP KO (n = 10), or SFR SAP dKO (n = 11) mice were immunized with NP-OVA (10 µg) plus alum, and serum was obtained at the indicated times to measure anti-NP-specific antibodies. The protocol (B) and data for IgM (at day 14; C, left) and IgG1 over time (C, middle) are shown. The ratios of IgG1 in mutant mice over WT mice at different times are shown in (C, right). Results are pooled from four experiments. (D–H) WT (n = 9) and SFR KO mice (n = 13) were immunized as in B. In addition, at week 17 after immunization, mice were boosted by i.p. injection of a second dose of NP-OVA (10 µg) in the absence of adjuvant. Antibody production was measured at the indicated time points. Results are from one experiment. Protocol (D) and levels of anti-NP IgG1 (E, left) are shown. The time of the boost is indicated by a black arrowhead. The ratios of IgG1 in mutant mice over WT mice at day 140 are shown in (E, right). (F) The ELISA depicted in E was repeated in the presence of 1 M NaSCN. (G) Same as E, except that NP(30) was used as capture antigen. (H) The ratios of the mean titers of antibodies in SFR KO mice over WT mice over time are shown. Each symbol represents a mouse. *, P < 0.05; **, P < 0.01; ***, P < 0.001; ****, P < 0.0001 (two-tailed Student’s t test). Data are shown as mean ± SEM. D, day; ns, not significant.

