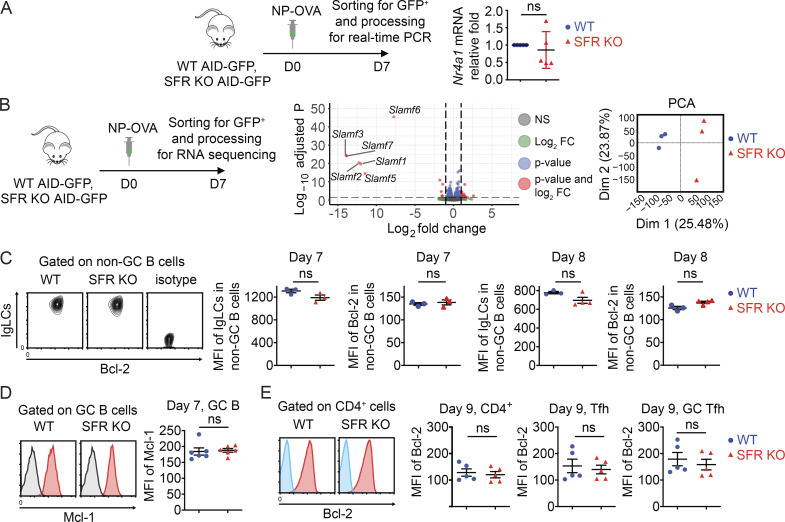
Figure S4.
Augmented expression of Bcl-2 can rescue B cell responses in SFR KO mice. Related to Fig. 8. (A) Same as Fig. 8 B, except that abundance of Nur77-encoding RNA (Nr4a1) was determined by real-time PCR of RNA from sorted AID-GFP+ cells. Relative fold of RNA expression in SFR KO mice over that in WT mice is depicted (WT, n = 5; SFR KO, n = 5). Data are pooled from two experiments. (B) GC B cells were purified from the indicated mice. RNA was then isolated and processed for RNA sequencing. Protocol is depicted on the left. Volcano plot of gene expression differences and statistical significance between WT and SFR KO mice are shown in the middle. Log2 FC and log−10 of the P value of these changes are represented. PCA is depicted on the right. Data are from one experiment. (C) Same as Fig. 8 D, except that non-GC B cells were analyzed. For day 7, WT, n = 3; and SFR KO, n = 3. For day 8, WT, n = 3; and SFR KO, n = 4. Data are from one experiment. (D) Same as Fig. 8 D, except that expression of Mcl-1 in GC B cells was analyzed. Black line, WT cells stained with isotype control. WT, n = 6; SFR KO, n = 6. Data are pooled from two experiments. (E) Mice were immunized with NP-OVA, and on day 9, expression of Bcl-2 was detected in CD4+ T cells, Tfh cells, and GC Tfh cells. Blue line, isotype control. WT, n = 5; SFR KO, n = 5. Data are pooled from two experiments. Each symbol represents one mouse. Data are shown as mean ± SEM. D, day; FC, fold change; ns, not significant (two-tailed Student's t test); PCA, principal-component analysis.

