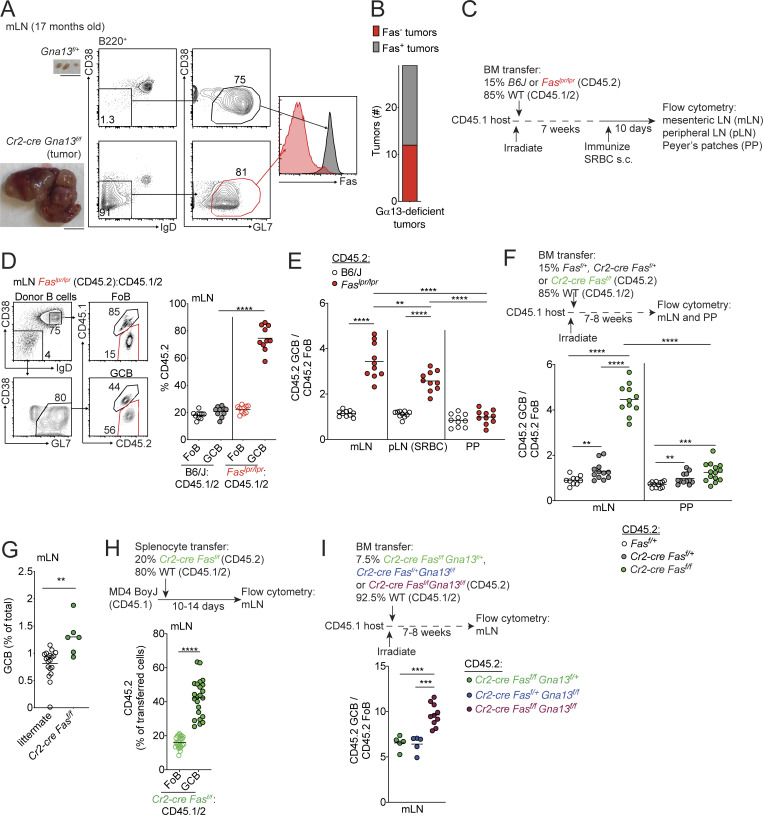
Figure 1.
Fas is required to constrain survival of GC B cells in vivo in a tissue-specific manner. (A) Fas expression on GC B cells from an mLN tumor from a 17-mo-old Cr2-cre Gna13f/f animal or littermate control. Gross appearance of the mLN is shown in images on the left. Scale bar, 1 cm. (B) Frequency of loss of Fas expression on GC B cell tumors from animals aged 12–20 mo with B cell–specific Gα13 deficiency (n = 29). (C) Experimental scheme for data in D and E. (D) Percentages of CD45.2 FoB cells and GC B cells (GCB) in mLNs of mixed BM chimeras generated with a mixture of 85% WT (CD45.1/2) and 15% CD45.2 BM that was B6/J or Faslpr/lpr, assessed by FACS. Example gating strategy for FoB cells and GC B cells is shown on the left in D. (E) Ratio of frequency of CD45.2 GC B cells to CD45.2 FoB cells in B6J or Faslpr/lpr mixed BM chimeras in mLNs, SRBC-immunized pLNs, and PPs. Data in D and E are pooled from two independent experiments with five mice per group. (F) Ratio of frequency of CD45.2 GC B cells to CD45.2 FoB cells in mLNs and PPs of mixed BM chimeras generated with 85% WT (CD45.1/2) and 15% CD45.2 BM that was Fasf/+, Cr2-cre Fasf/+, or Cr2-cre Fasf/f. Data are pooled from two independent experiments with five to seven mice per group. (G) Frequency of GC B cells among total cells in mLNs from littermate control or Cr2-cre Fasf/f animals. Data are pooled from four independent experiments with one to four mice per group. (H) Frequency of CD45.2 cells among FoB cells or GC B cells derived from donor cells in mLNs of MD4 BoyJ mice that were given a mixture of splenocytes that were 80% WT (CD45.1/2) and 20% Cr2-cre Fasf/f (CD45.2) 10–14 d before analysis. Data are pooled from five independent experiments with four to six mice per group. (I) Ratio of frequency of CD45.2 GC B cells to CD45.2 FoB cells from mLNs of mixed chimeras generated with a mixture of 92.5% WT (CD45.1/2) and 7.5% CD45.2 BM that was Cr2-cre Fasf/f Gna13f/+, Cr2-cre Fasf/+Gna13f/f, or Cr2-cre Fasf/fGna13f/f, assessed by FACS. Data are pooled from two independent experiments with 5–10 mice per group total. ****, P < 0.0001, paired two-tailed Student’s t test for data in H. For all other data, **, P < 0.01; ***, P < 0.001; ****, P < 0.0001, unpaired two-tailed Student’s t test.

