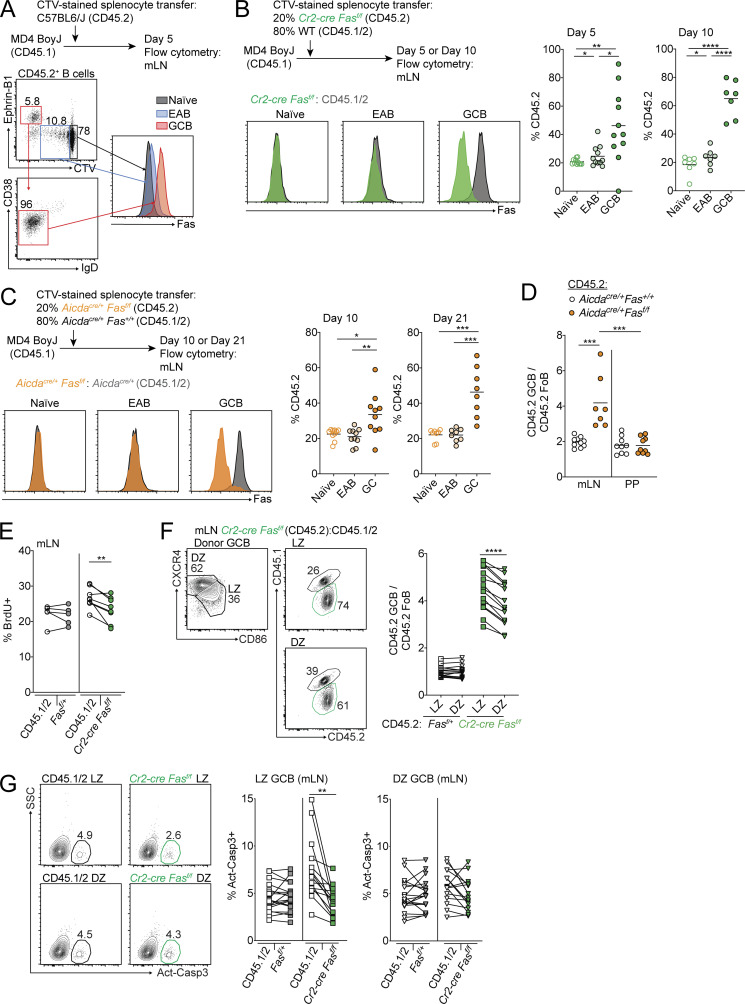
Figure 2.
Fas-dependent deletion occurs in the GC LZ. (A) Fas expression on CD45.2+ naive B cells (gray), EAB cells (blue), and GC B cells (red) in mLNs of MD4 BoyJ mice that were given CTV-labeled CD45.2+ splenocytes 5 d before analysis. Naive B cells were defined as CD45.2+ B cells that had not diluted CTV; EAB cells were defined as CD45.2+ B cells that had diluted CTV but did not express the GC marker Ephrin-B1; and GC B cells were defined as CD45.2+ B cells that were Ephrin-B1+CTV−IgDloCD38lo. Data are representative of two independent experiments. (B) MD4 BoyJ mice were given a mixture of CTV-labeled splenocytes that were 20% Cr2-cre Fasf/f and 80% WT (CD45.1/2). Left panel shows Fas expression among transferred naive, EAB, or GC B cells that were Cr2-cre Fasf/f (green) or WT (CD45.1/2; gray) in mLNs 5 d after transfer. Middle and right panels show frequency of Cr2-cre Fasf/f (CD45.2+) among transferred cells that were naive, EAB, or GC B cells in mLNs 5 or 10 d after transfer. Data are pooled from two independent experiments for day 5 and three independent experiments for day 10 with three or four mice per experiment. (C) MD4 BoyJ mice were given a mixture of CTV-labeled splenocytes that were 20% Aicdacre/+Fasf/f and 80% Aicdacre/+Fas+/+ (CD45.1/2). Left panel shows Fas expression among transferred naive, EAB, or GC B cells that were Aicdacre/+Fasf/f (orange) or Aicdacre/+Fas+/+ (CD45.1/2; gray) in mLNs 10 d after transfer. Middle and right panels show the frequency of Aicdacre/+Fasf/f (CD45.2+) among transferred cells that were naive, EAB, or GC B cells in mLNs 10 or 21 d after transfer. Data are pooled from four independent experiments with two to four mice per time point. (D) Ratio of frequency of CD45.2 GC B cells to CD45.2 FoB cells in mLNs and PPs of mixed BM chimeras generated with 85% WT (CD45.1/2) and 15% CD45.2 BM that was Aicdacre/+Fas+/+ or Aicdacre/+Fasf/f. Data are from one experiment representative of two with 10 and 9 mice per group. (E) Intracellular FACS for BrdU incorporation in GC B cells from mLNs of Fasf/+ or Cr2-cre Fasf/f mixed BM chimeras generated as in Fig. 1 F that were treated i.p. with BrdU 30 min before sacrifice. Data are from five and eight mice of each type from one experiment representative of two independent experiments. (F) Ratio of frequency of Fasf/+ or Cr2-cre Fasf/f (CD45.2+) cells in LZ or DZ GC B cells relative to FoB cells in mLNs of mixed BM chimeras generated as in Fig. 1 F. Left panel shows example of gating strategy for LZ and DZ GC B cells. (G) Intracellular FACS for active caspase-3 in LZ or DZ GC B cells from mLNs of Cr2-cre Fasf/f mixed BM chimeras generated as in Fig. 1 F analyzed directly ex vivo. Left panel shows an example of the gating strategy for active caspase-3+ cells. Data in F and G are pooled from seven experiments with two or three mice per group per experiment. ***, P < 0.001, unpaired two-tailed Student’s t test for data in D. For all other data, *, P < 0.05; **, P < 0.01; ***, P < 0.001; ****, P < 0.0001, paired two-tailed Student’s t test. SSC, side scatter.

