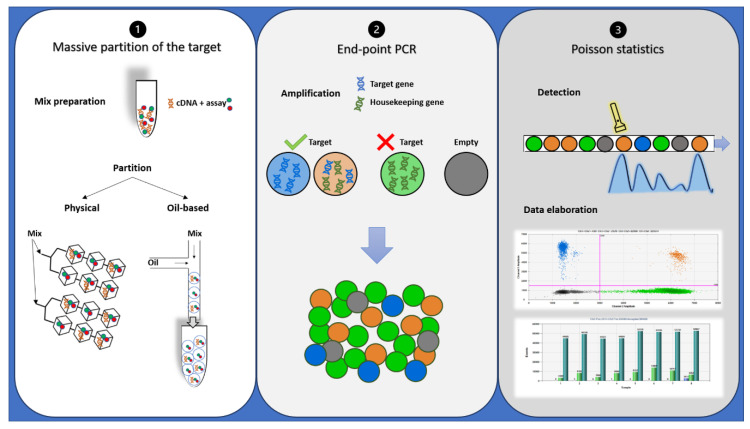
Figure 2.
Description of droplet PCR workflow: (1) PCR reaction mixtures for each sample were partitioned in a microfluidic chip or through an oil-based emulsion. (2) The partitioned samples were placed into a standard thermal cycler for end-point PCR amplification: In the droplets containing target cDNA, the specific probe hydrolysis occurs and bright fluorescence appears, while in the droplets containing no target molecules (empty), only background probe fluorescence results. (3) Each droplet’s fluorescence was detected and processed into a two-dimensional scatter plot display. The number of droplets within each gate was then counted.

