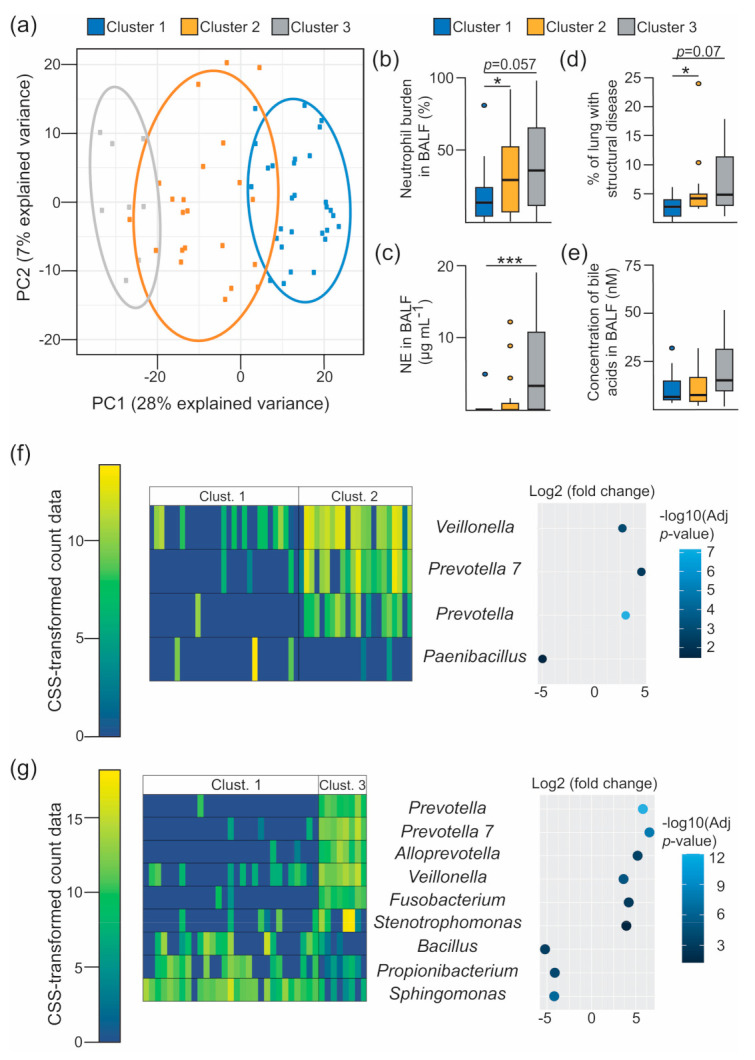
Figure 2.

Inflammatory surrogates in BALF are linked to specific microbial assemblages. (a) Principal component analysis decomposition of the OTU counts transformed using the cumulative sum scaling (CSS) normalization method. Mean-centering was performed to better represent the direction of variability across group centroids. BALF-associated taxonomic profiles are projected onto the first two components of the model. Dots represent each BALF specimens, which are coloured accordingly with the Gaussian Mixture Model-based cluster membership (cluster 1, n = 29 BALF specimens; cluster 2, n = 22; cluster 3, n = 8). Ellipses represent the 86% confidence region. (b–e) Boxplots showing between-cluster comparisons of the indicated markers of disease progression (b–d) and bile acid concentration (e) in BALF. Multiple comparisons were assessed for significance in the context of Dunnett’s test. *, p < 0.05; ***, p < 0.001. (f,g) Heatmaps (left) and bivariate dot plot (right) representing the CSS-normalised count data and the fold change (log2 scale) for the selected OTUs between the indicated clusters (Clust.), respectively. Differentially abundant features between clusters were estimated from a zero-inflated log-normal model as implemented in the fitFeatureModel method [20]. Features with a log2 (fold change) > |2| and an FDR-corrected (adjusted p-value) p-value < 0.05 are depicted. Colour legend for the heatmap (left), and the dot plot (right), represent the CSS-transformed count data and the –log10 (adjusted p-value) respectively. Each column in the heatmaps represents the profiles of individual BALF samples, and rows represent the indicated OTUs.
