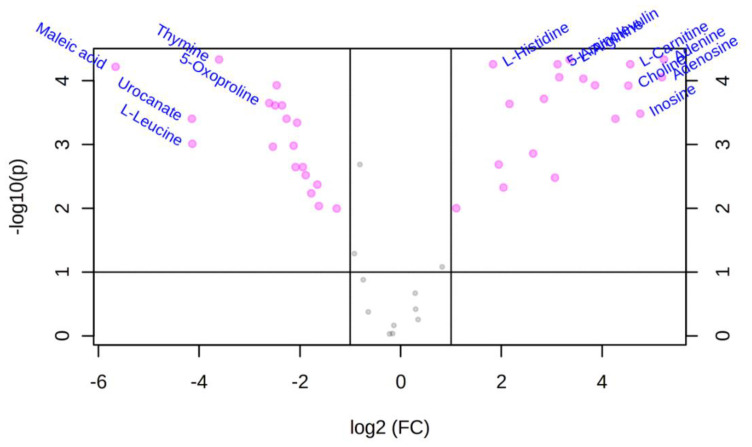
Figure 3.
Volcano plot of untargeted metabolomics analysis of differential features (i.e., 49 MSI-I (Metabolomics Standard Initiative level-1) identified polar metabolites from somatic extracts) between the somatic extract of infective third-stage larvae (L3) of N. brasiliensis (NB_SE) and the somatic extract of T. muris embryonated eggs (TM_SE). The volcano plot displays log2 fold changes versus Benjamini–Hochberg adjusted p-values (−log10 transformed). Features that exhibited an absolute log2 fold change > 2 and an absolute p-value < 0.05 are coloured in pink. Most significant metabolites are labelled with the corresponding name.

