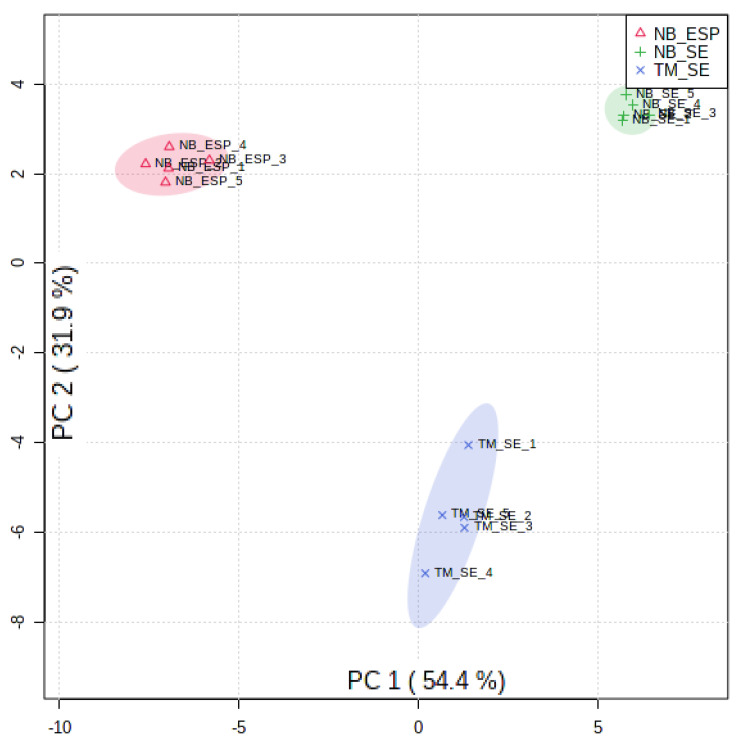
Figure 4.
Principal component analysis scores plot for three sample groups, i.e., the somatic extract of infective third-stage larvae (L3) of N. brasiliensis (NB_SE) (green), the excretory/secretory products (ESP) of N. brasiliensis L3 (NB_ESP) (red), and the somatic extract of T. muris embryonated eggs (TM_SE) (blue) with five replicates each. Parentheses on each axis explain the amount of variance. Media (QC_Media) and pooled quality control (QC_P) values were excluded from the analysis, as they were subtracted from the samples.

