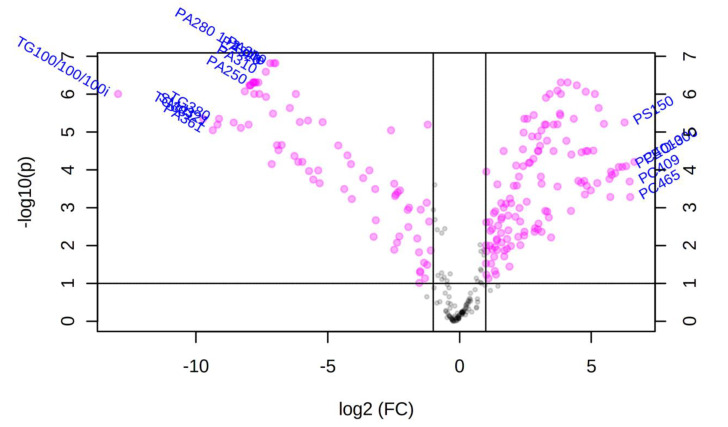
Figure 7.
Volcano plot of the untargeted lipidomics analysis of differentially regulated features between the somatic extract of infective third-stage larvae (L3) of N. brasiliensis (NB_SE) and the somatic extract of T. muris eggs (TM_SE). The volcano plot displays log2 fold changes versus Benjamini–Hochberg adjusted p-values (-log10 transformed). Features that exhibited an absolute log2 fold change > 2 and an absolute p-value < 0.05 are coloured in pink. Most significant features which could be structurally annotated are labelled with the corresponding name. Gray dots represent features that were not significantly altered (having fold change less than 2). The further its position away from the (0,0), the more significant the lipid is.

