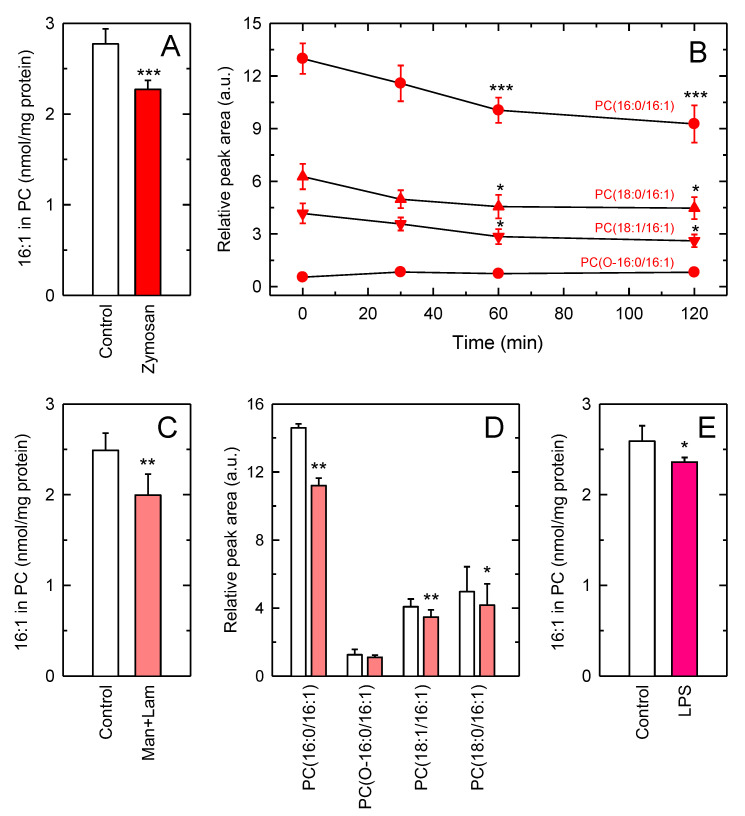
Figure 2.
Effect of macrophage activation on the cellular levels of 16:1-containing PC. (A) The cells were either untreated (control) or stimulated with 1 mg/mL zymosan for 1 h. Afterward, the content of 16:1 fatty acid in PC was determined. These results are shown as means ± standard error (n = 6). *** p < 0.001, significance of zymosan-stimulated cells versus control cells. (B) Time-course of the effect of zymosan on the levels of 16:1-containing PC species. Results are shown as means ± standard error (n = 6). *** p < 0.001 or * p < 0.05, significance of zymosan-stimulated cells at the indicated times versus unstimulated conditions (zero time). (C) The cells were either untreated (control) or stimulated with 0.5 mg/mL mannan (Man) plus 0.5 mg/mL laminarin (Lam) for 1 h. Afterward, the content of 16:1 fatty acid in PC was determined. Results are shown as means ± standard error (n = 6). ** p < 0.01, significance of Man and Lam-stimulated cells versus control cells. (D) The different 16:1-containing PC species were measured in unstimulated cells (open bars) or cells stimulated with 0.5 mannan plus 0.5 mg/mL laminarin (red bars) for 1 h. Results are shown as means ± standard error (n = 6). ** p < 0.01 or * p < 0.05, significance of Man and Lam-stimulated cells versus control cells within each species. (E) Raw cells were either untreated (control) or stimulated with 200 ng/mL bacterial lipopolysaccharide (LPS) for 6 h. Afterward, the content of 16:1 fatty acid in PC was determined. Results are shown as means ± standard error (n = 6). * p < 0.05, significance of LPS-stimulated cells versus control cells.

