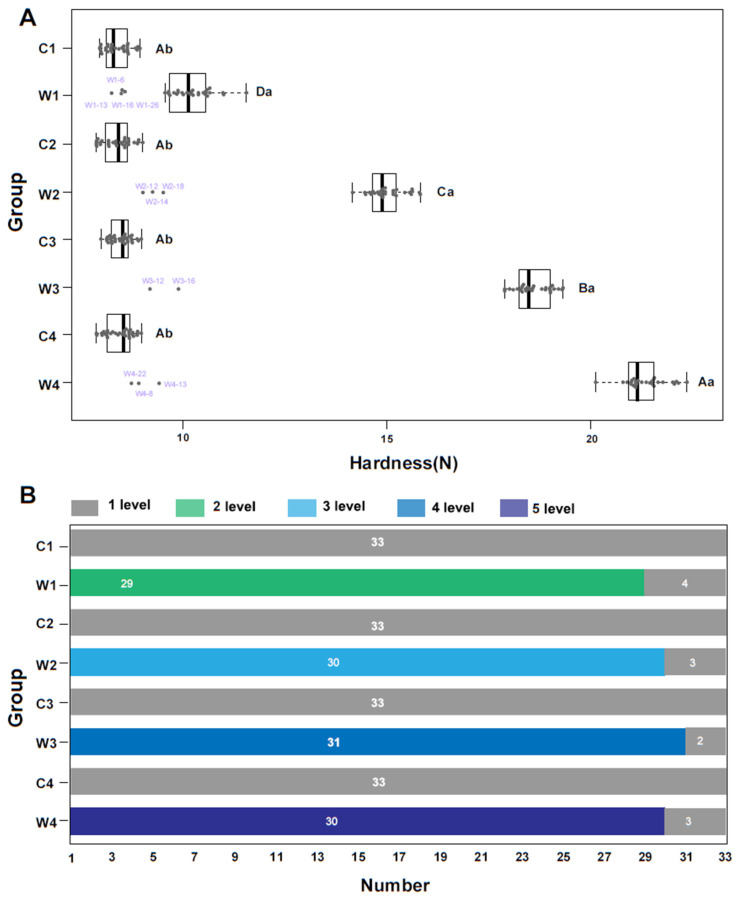
Figure 1.
Removal of outliers using muscle hardness. C1, C2, C3, and C4 represent the ordinary grass carp from 30, 60, 90, and 120 day, respectively. W1, W2, W3, and W4 represent the crisp grass carp from 30, 60, 90, and 120 day, respectively. (A) Boxplot of muscle hardness of crisp grass carp and ordinary grass carp during different farming stages. Boxes represent the interquartile range, and whiskers delineate ± 1.5 times the interquartile range beyond the box boundaries. Points falling outside of the whiskers were considered outliers in this study. Statistical analyses were performed using Student’s t-test and Duncan’s test. Different lowercase letters represent significant differences in muscle hardness (p < 0.05). Different uppercase letters represent significant differences in muscle hardness (p < 0.05). (B) Sensory texture evaluation of crisp grass carp and ordinary grass carp during different farming stages. Samples from 33 fish were evaluated for each group.

