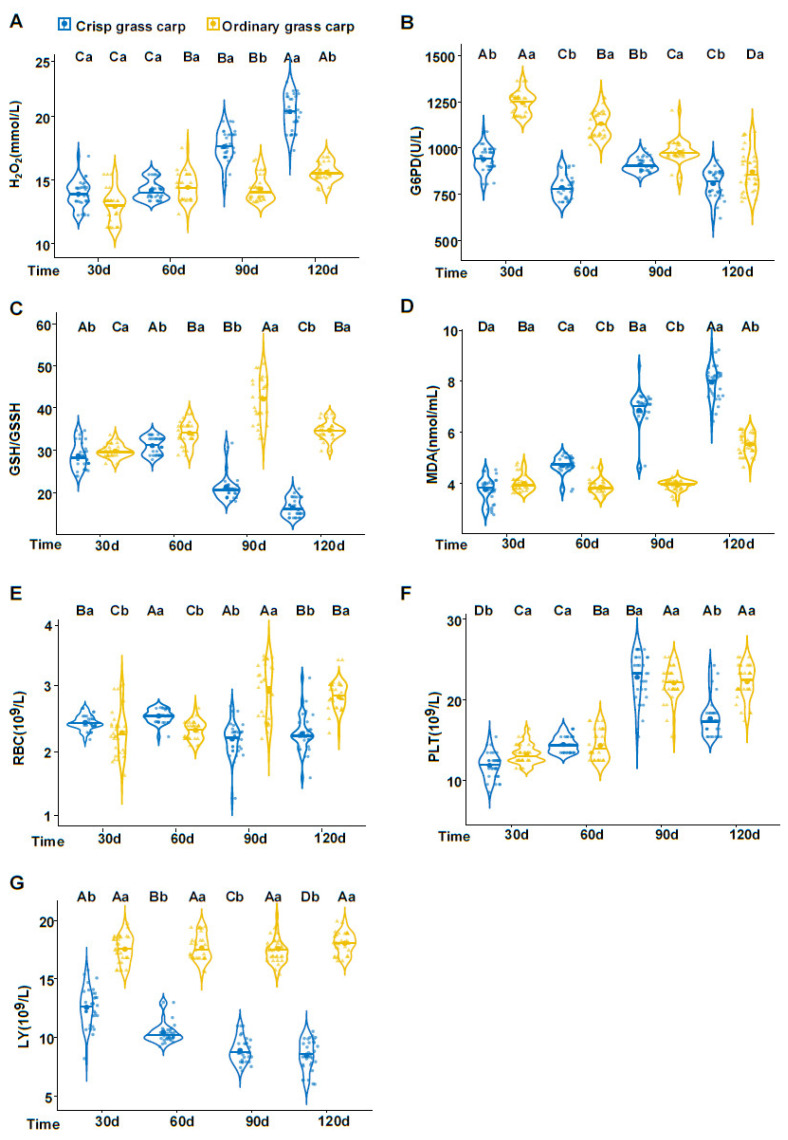
Figure 2.
Violin plots of seven blood indexes in ordinary and crisp grass carp samples. The medians are represented by a horizontal blue or yellow line. The whiskers span the entire range. (A) H2O2. (B) G6PD. (C) GSH/GSSH. (D) MDA. (E) RBC. (F) PLT. (G) LY. Statistical analyses were performed using Student’s t-test and Duncan’s test. Different lowercase letters represent significant differences in blood indexes. Different uppercase letters represent significant differences in blood indexes (p < 0.05).

