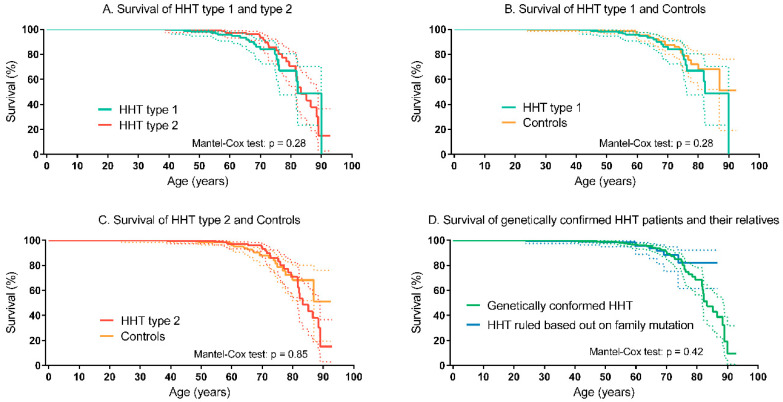
Figure 3.
Left-truncated Kaplan–Meier curves of HHT subtypes and controls (A) HHT type 1 and HHT type 2. (B) HHT type 1 and controls. (C) HHT type 2 and controls. (D) Patients with genetically confirmed HHT (HHT type 1, type 2 and juvenile polyposis/HHT overlap syndrome) and their relatives without HHT. The dotted lines represent the 95% confidence intervals. HHT, Hereditary Hemorrhagic Telangiectasia.

