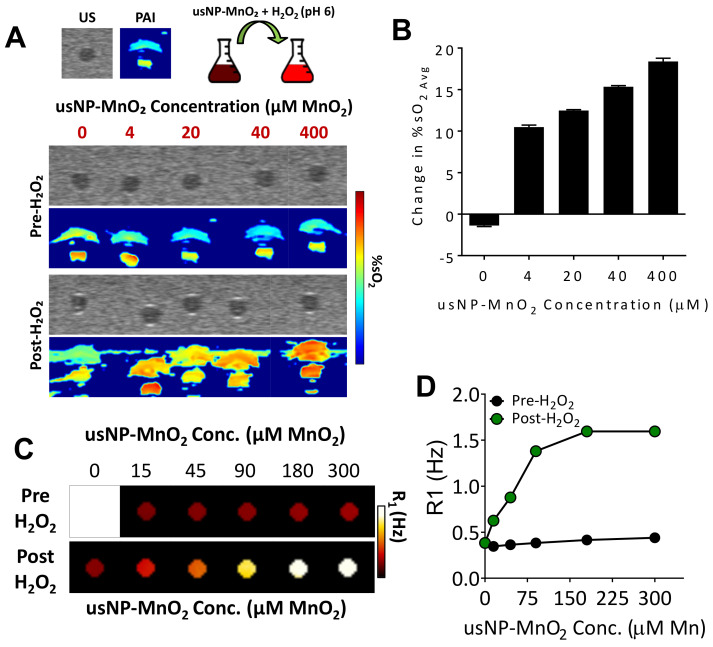
Figure 3.
Oxygen-generating capacity and MR-compatibility of usNP-MnO2 under reductive and acidic conditions in vitro. (A) Pseudo-colorized oxygen saturation maps of blood containing varying concentrations of usNP-MnO2 before (pre) and after (post) the addition of H2O2. (B) Bar graph shows the change in blood %sO2 following the addition of H2O2 for each usNP-MnO2 concentration. (C) Pseudocolorized T1-relaxation rate (R1) maps of usNP-MnO2 in water at increasing concentrations before (pre) and after (post) exposure to H2O2. (D) Graph shows corresponding R1 measurements for each usNP-MnO2 concentration before and after H2O2.

