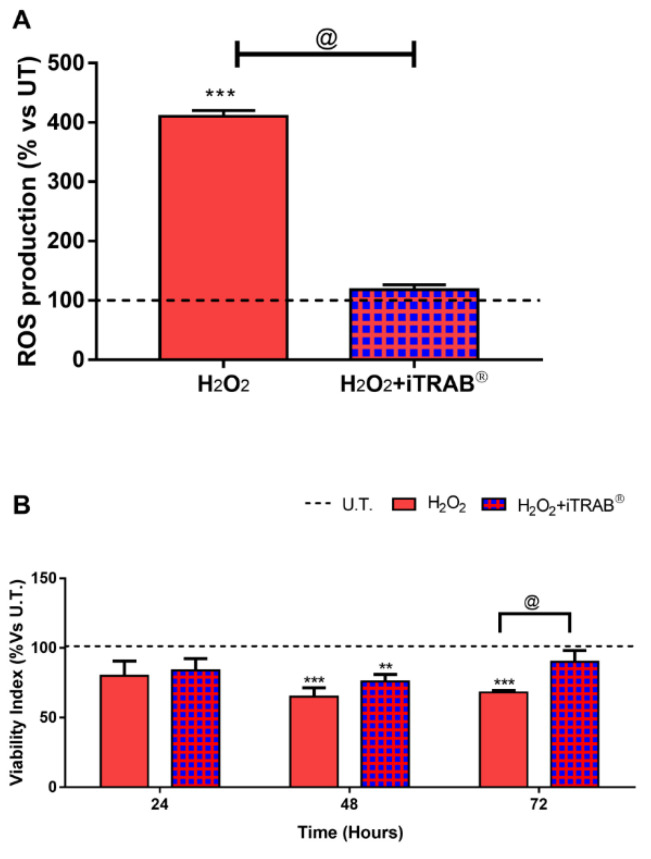
Figure 1.
Reactive oxygen species (ROS) Production and Viability. (A) ROS production. Dichlorofluorescein (DCF) assays were performed after 2 h of experimental procedures. (B) Viability index. Viability indices were performed by Alamar blue assay. Data areexpressed as % vs. untreated (U.T) 3D-human trabecular meshwork cells (3D-HTMCs) and represent the mean ± standard deviation (SD) of 3 independent experiments. ***,** treated 3D HTMCs vs. UT; @ H2O2-treated vs. H2O2+iTRAB-treated 3D HTMC. ***/@ p < 0.001;** p < 0.01 (Two-way ANOVA followed by Bonferroni’s test).

