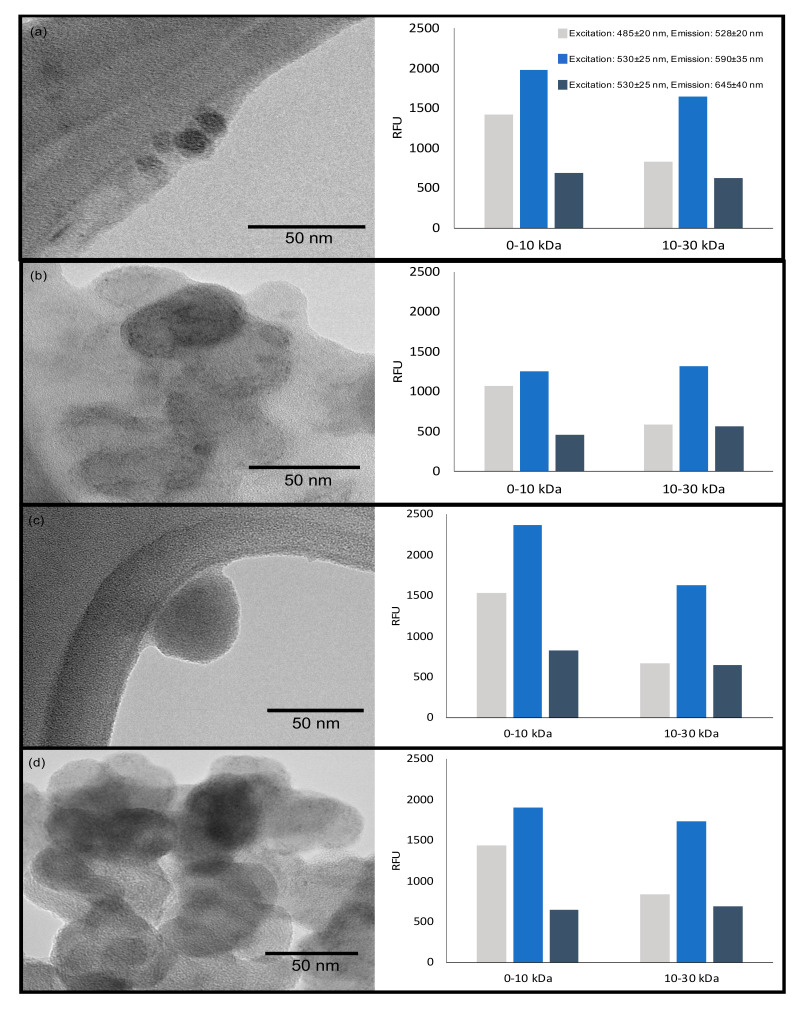
Figure 8.
Transmission electron microscopy (TEM) images from (a) carbon dots from CB, (b) carbon dots from CB.H2SO4, (c) carbon dots from CB.KOH, and (d) carbon dots from CB.H2SO4 + KOH. The bar plots show the mean relative fluorescence units (RFU) at different emission ranges of carbon dots from fraction 0 to 10 kDa and 10 to 30 kDa. Note: Water was used as a control for fluorescence measurements; the maximum difference between the replicas was 101 RFU.

