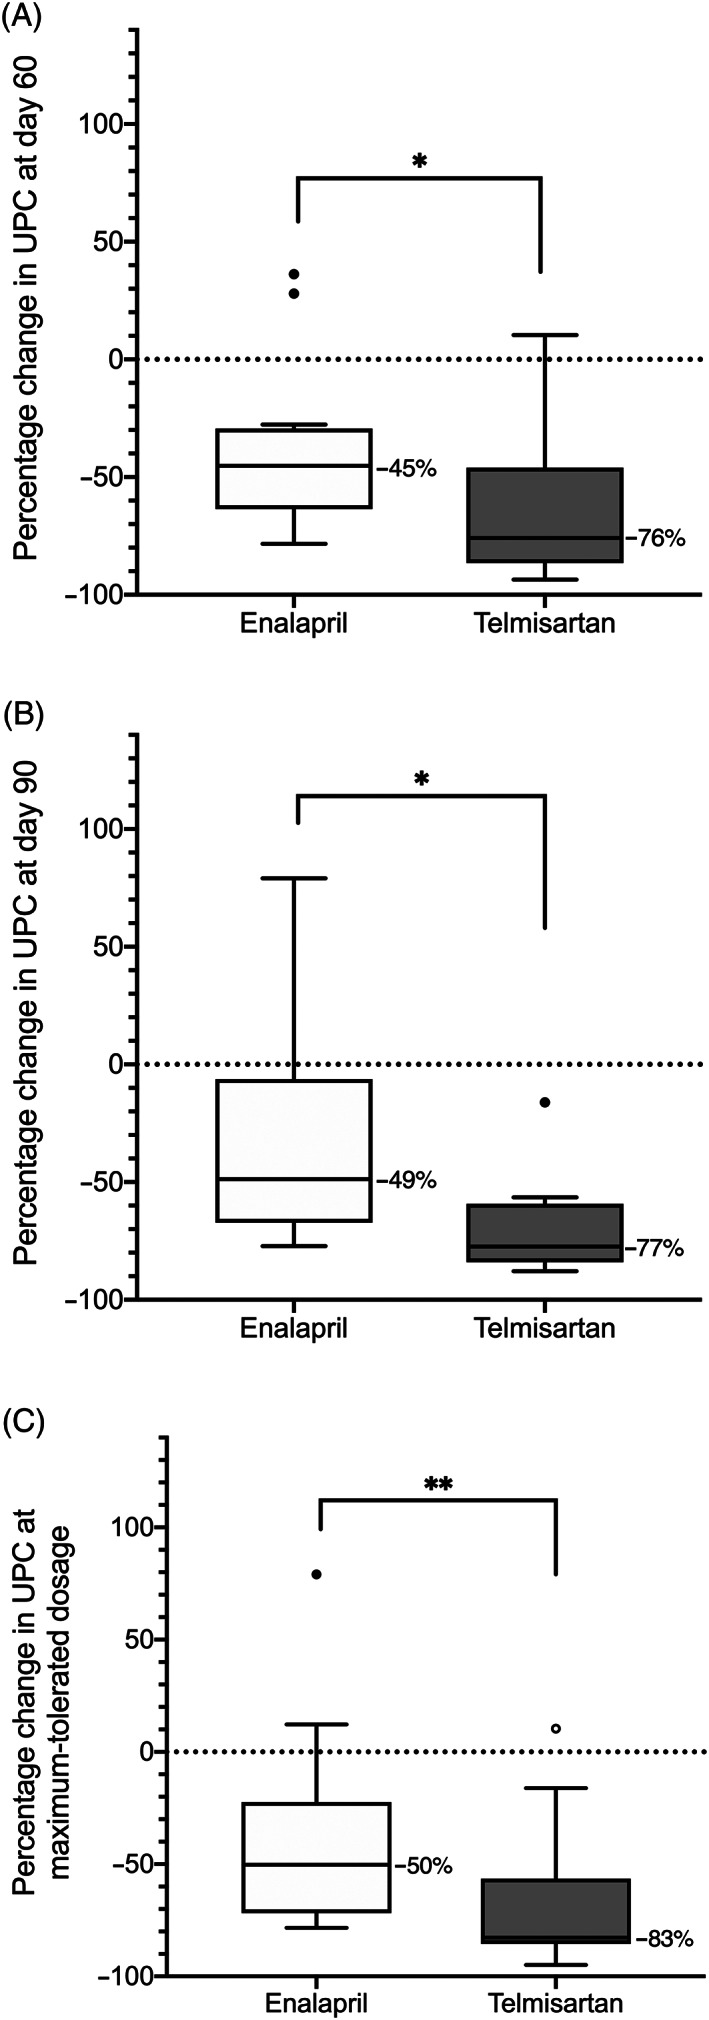
FIGURE 6.

Box‐plot of percentage change in urinary protein‐to‐creatinine ratio (UPC) relative to baseline in proteinuric dogs randomized to receive enalapril or telmisartan. A, Percentage change in UPC relative to baseline after 60 days of therapy in 12 dogs receiving enalapril (0.5 mg/kg PO q12h for 30 days, followed by 1.0 mg/kg PO q12h thereafter) and 13 dogs receiving telmisartan (1 mg/kg PO q24h for 30 days, followed by 2 mg/kg PO q24h thereafter). B, Percentage change in UPC relative to baseline after 90 days of therapy in 9 dogs receiving progressively greater dosages of enalapril (0.5 mg/kg PO q12h on study days 0‐30, 1.0 mg/kg PO q12h on study days 31‐60, 1.5 mg/g PO q12h on study days 61‐90) and 8 dogs receiving progressively greater dosages of telmisartan (1 mg/kg PO q24h on study days 0‐30, 2 mg/kg PO q24h on study days 31‐60, 3 mg/kg PO q24h on study days 61‐90). C, Percentage change in UPC relative to baseline in 16 dogs receiving the maximum‐tolerated dosage of enalapril (ranging from 0.5‐1.5 mg/kg PO q12h) and 19 dogs receiving the maximum‐tolerated dosage of telmisartan (ranging from 1‐3 mg/kg PO q24h). Maximum‐tolerated dosage for a given dog was defined as the maximum dosage received without the occurrence of adverse events that would trigger removal from the study (ie, hypotension, azotemia, hyperkalemia, or any combination of these). Boxes represent interquartile range, and the horizontal bar within each box and numbers to the right of it represent the median. Upper and lower bars and outliers (circles) are plotted using the method of Tukey. One telmisartan‐treated dog, represented by the open outlier data point, was later found to have an active Borrelia burgdorferi infection. *P < .05. **P < .01
