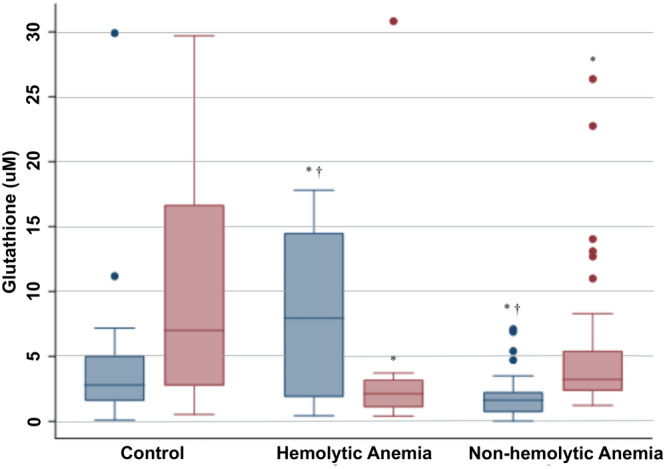
FIGURE 1.

Plasma (blue boxes) and red blood cell (RBC) hemolysate (red boxes) reduced glutathione (GSH) concentrations for control dogs (N = 40), and dogs with hemolytic (N = 10) and nonhemolytic anemia (N = 37), respectively, are depicted in box‐and‐whisker plots. The top and bottom of each box represent the first and third quartiles, respectively, and the midline represents the median. The whiskers represent the range, with outliers represented by individual data points. An “*” denotes a significant difference when compared to healthy controls, and a “†” denotes a significant difference between anemia subtypes
