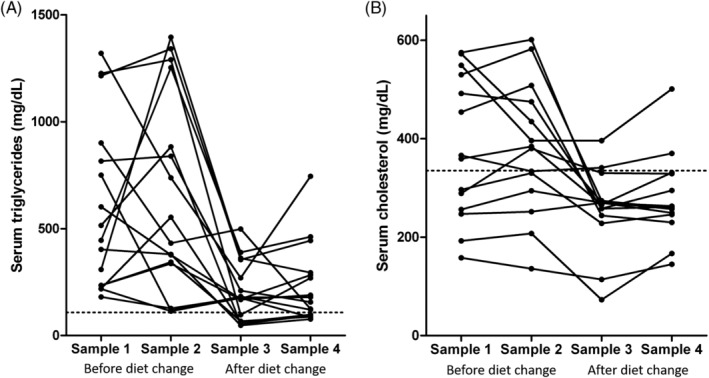
FIGURE 1.

A, Serum triglyceride and, B, cholesterol concentrations in dogs with hypertriglyceridemia before and after diet change. Samples 1 and 2 were collected while dogs were on their original diets. Samples 3 and 4 were collected approximately 8 and 12 weeks, respectively, after the dogs were placed on the study diet. There was a significant decrease in serum triglyceride (P < .001) and cholesterol (P < .001) concentrations after the diet change. The dotted lines represent the upper limit of the reference interval. See also Tables 4 and 5
