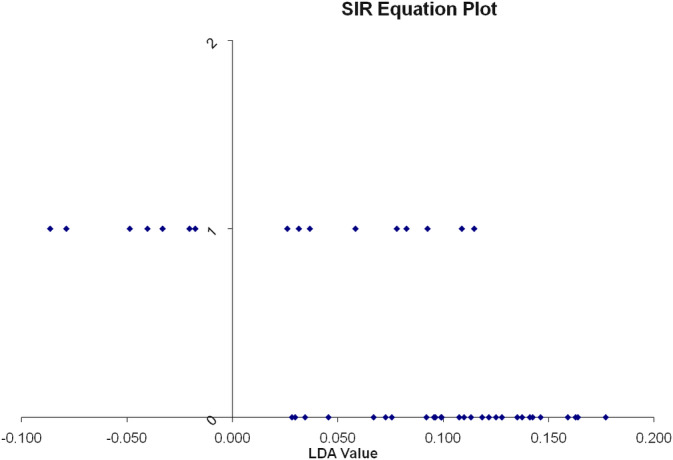
FIGURE 3.

One dimensional SIR plot showing classification of dogs into groups based on lipoprotein profile analysis after the diet change. The vertical line represents the line that separates the 2 groups based on their lipoprotein profile analysis. The LDA value provides a ranking value for each dog. The dogs represented by the dots that are at the bottom of the graph are the dogs of the control group. Their lipoprotein profiles plot them all to the right of the vertical line. The dogs represented by the dots at the top of the graph are the dogs of group 1 (with hypertriglyceridemia) after the diet change. Nine of the 16 dogs are now classified to the right of the vertical line together with the control dogs, suggesting that they are considered normal based on their lipoprotein profile analysis. The remaining 7 dogs are classified separately from the control dogs even after the diet change. Note that there is a clear separation between dogs of group 1 that responded to the diet change and those that did not. LDA, linear discriminant analysis
