
FIGURE 4.
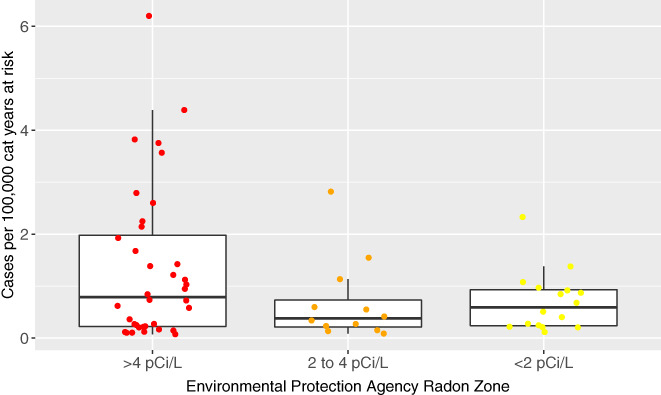
Box and whisker jittered plot representing the incidence of primary pulmonary neoplasia (PPN) per 100 000 cat years at risk by county in each radon level using only PPN diagnosed definitively. Each circular dot represents 1 county's neoplasia rate per 100 000 cat years at risk based and is plotted based on the county's Environmental Protection Agency's (EPA) radon zone. The EPA definition of radon zones are as follows: zone 1: counties with predicted average indoor radon screening >4 pCi/L; zone 2: counties with predicted average indoor radon screening levels from 2 to 4 pCi/L; and zone 3: counties with predicted average indoor radon screening levels <2 pCi/L. The horizontal lines of the box represent the 25, 50, and 75% quartiles of the estimates