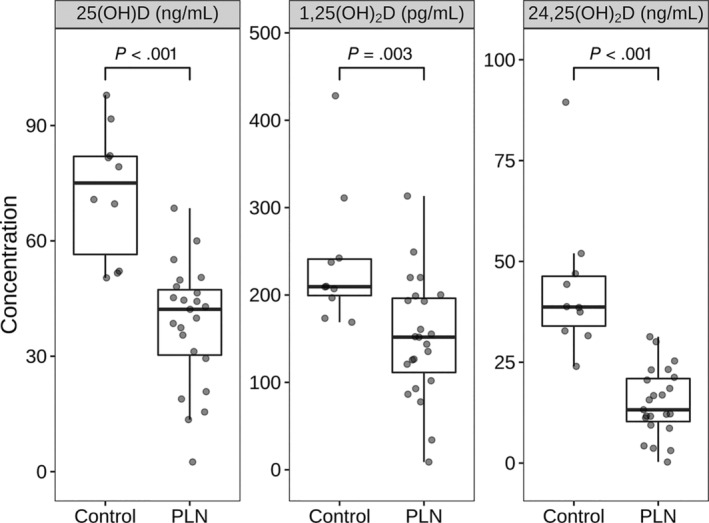
FIGURE 1.

Serum vitamin D concentrations in dogs with PLN and control dogs. Each dot represents a dog. The boxes represent the 25th and 75th percentiles, and the central lines in the boxes represent the median (50th percentile) values. The whiskers extend up to 1.5*IQR below and above the 25th and 75th percentiles respectively. Points above and below the whiskers are indications for outlier values. The dogs with protein‐losing nephropathy (PLN) had lower vitamin D concentrations (Wilcoxon rank‐sum test, P < .001)
