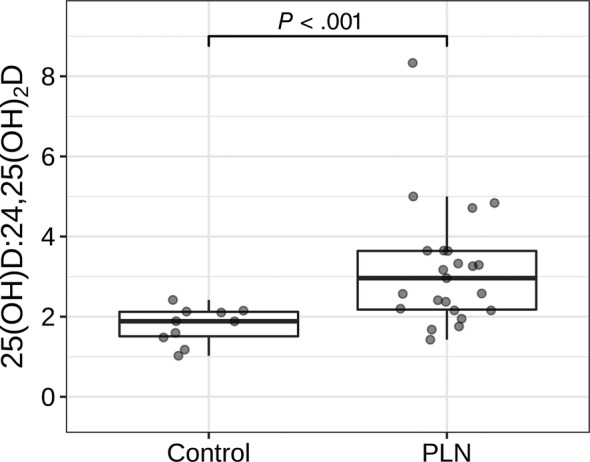
FIGURE 2.

Serum 25(OH)D to 24,25(OH)2D ratios in dogs with protein‐losing nephropathy (PLN) and control dogs. Each dot represents a dog. The boxes represent the 25th and 75th percentiles, and the central lines in the boxes represent the median (50th percentile) values. The whiskers extend up to 1.5*IQR below and above the 25th and 75th percentiles respectively. Points above and below the whiskers are indications for outlier values. The dogs with PLN had higher average 25(OH)D to 24,25(OH)2D ratios (Wilcoxon rank‐sum test, P < .001)
