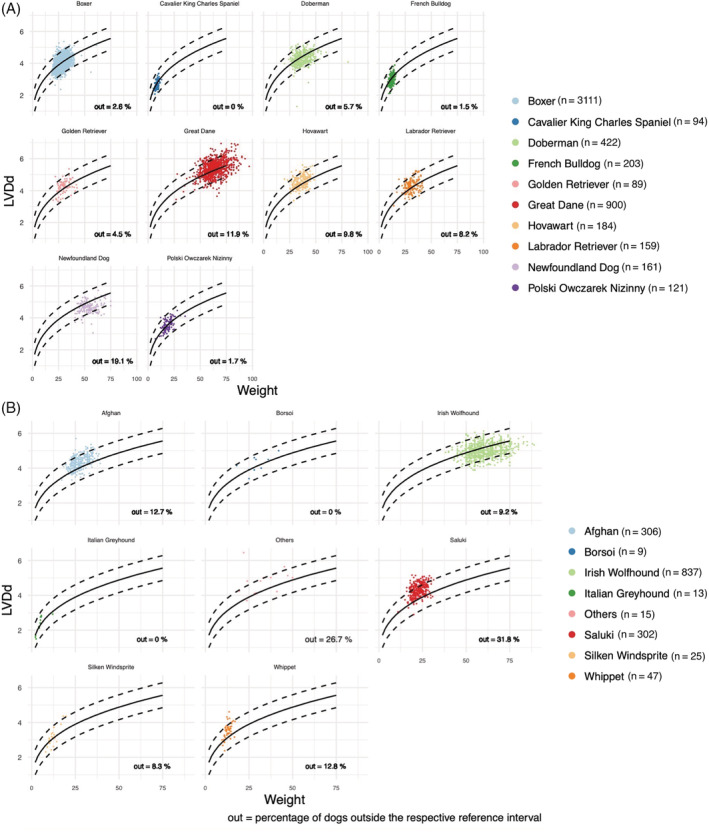
FIGURE 1.

Scatter plots with superimposed regression lines (solid lines) and 95% prediction intervals (broken lines) by breed for the LVDd as a function of body weight for breeds in the nonsighthound breed group (A) and for breeds in the sighthound group (B). The plots show how observed values fit inside the 95% PIs. LVDd, left ventricular diameter in diastole; PI, prediction interval
