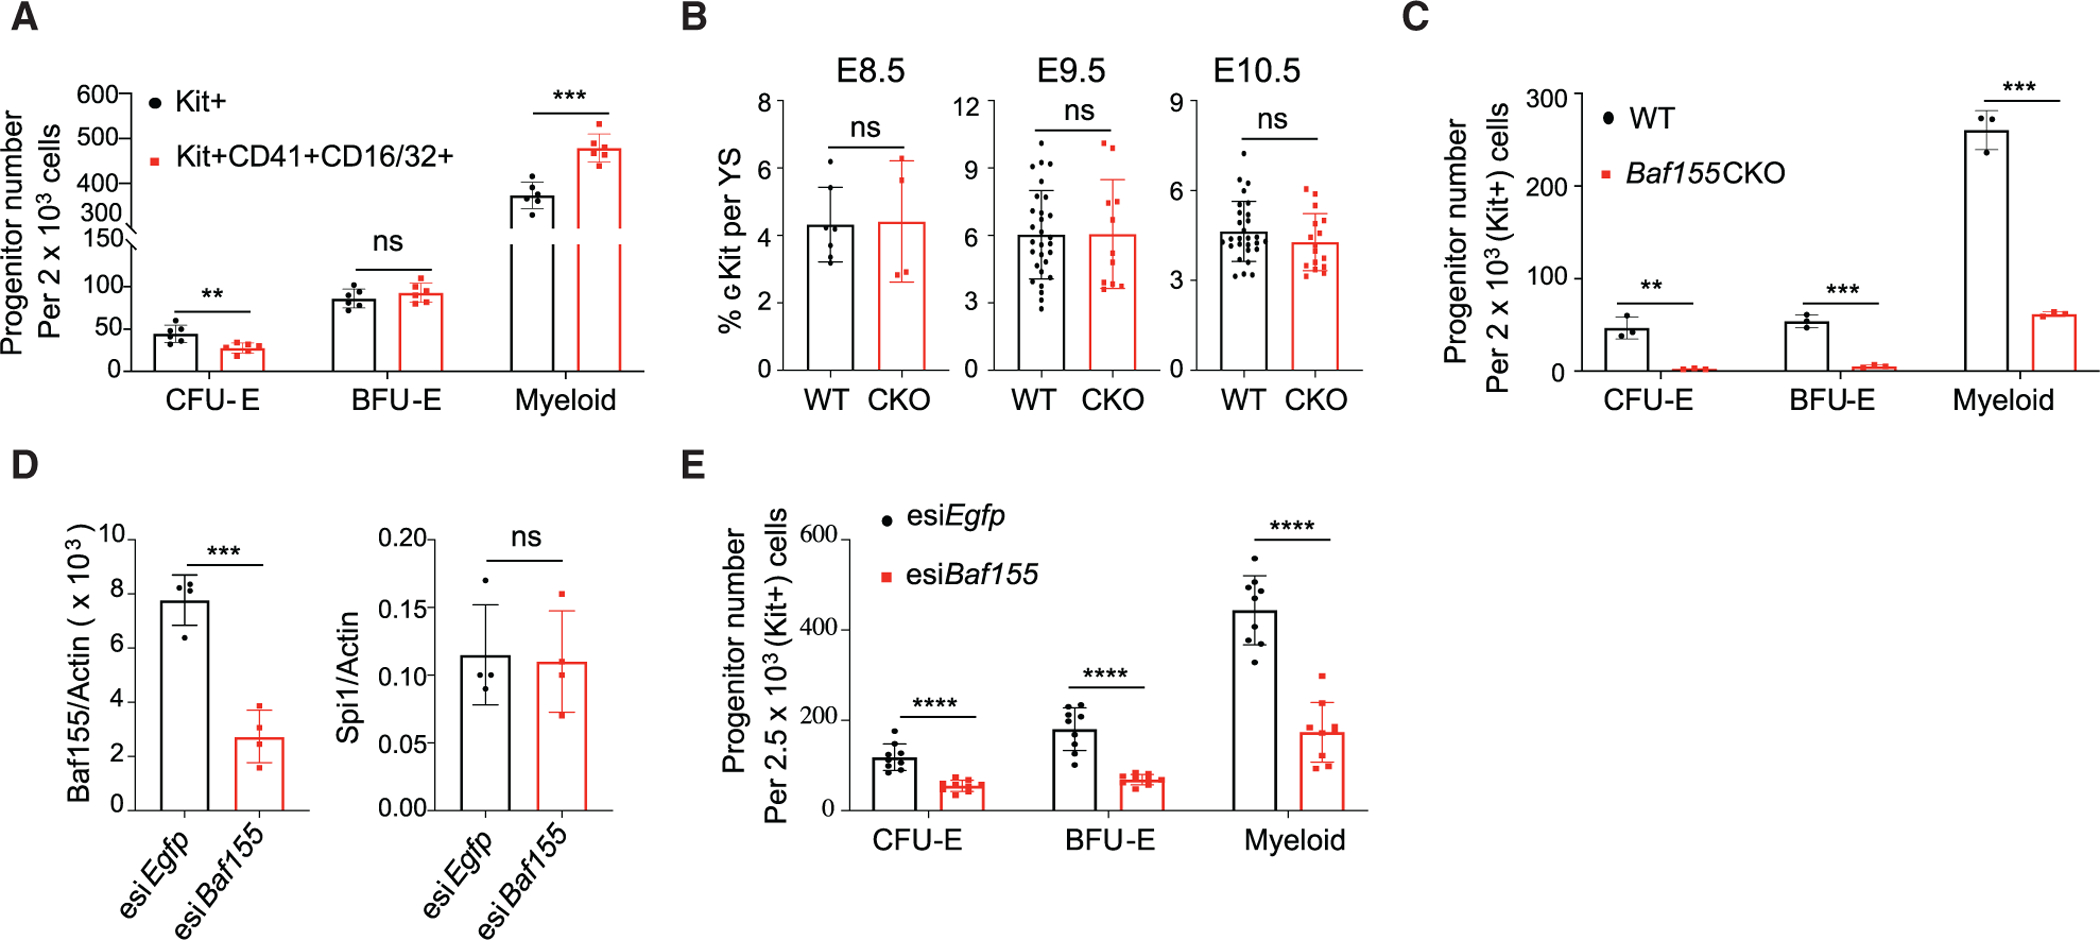
Figure 2. Baf155 Is Required for Myeloid and EryD Lineage Differentiation from EMPs.

(A) Distribution of CFU-E, BFU-E, and myeloid colonies developing from KIT+ and KIT+CD41+CD16/32+ population from WT E10.5 YSs. Data are presented as mean ± SD. Student’s t test; **p < 0.005, ***p < 0.001; 6 biological replicates.
(B) Flow cytometry analysis of the cKIT+ population per YS from WT and Baf155 CKO embryos on the indicated embryonic day. E8.5 data (mean ± SD) are from 2 independent experiments. E9.5 and E10.5 data (mean ± SD) are from 6 independent experiments, each representing a single YS. Data are presented as mean ± SD. Student’s t test.
(C) CFU-E, BFU-E, and myeloid colonies from cKIT+ cells from WT (n = 3) and Baf155 CKO (n = 3) YSs. Data are from 2 independent experiments, with each replicate consisting of a single or 2 pooled YSs of the same genotype. Data are presented as mean ± SD. Student’s t test; **p < 0.01, ***p < 0.001.
(D) qRT-PCR analysis of the indicated gene expression in cKIT+ cells from E10.5 WT YSs transfected with esiRNA against Baf155 or Egfp. Data are presented as mean ± SD. Student’s t test; ***p < 0.001; four biological replicates from 3 independent experiments.
(E) CFU-E, BFU-E, and myeloid colonies from cKIT+ cells from E10.5 WT YSs transfected with esiRNA against Baf155 or Egfp. Data are presented as mean ± SD. Student’s t test; ***p < 0.001. Nine biological replicates from 3 independent experiments.
See also Figure S2.
