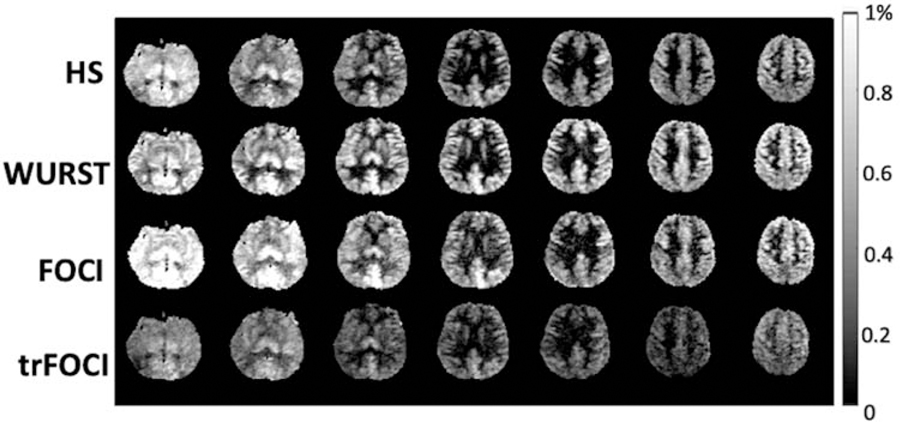
Figure 4.
Perfusion map acquired using the optimized adiabatic inversion pulses. For HS and FOCI, the residual tissue signal is dominant at bottom slices. the mean gray matter perfusion is 0.42%, 0.60%, 0.59%, 0.35%, for HS, WURST, FOCI and trFOCI, respectively. Adapted from Wang K, Shao X, Yan L, et al. Optimization of adiabatic pulses for Pulsed ASL at 7T – Comparison with Pseudo-continuous ASL. Proc ISMRM 2020;28:3695; with permission.

