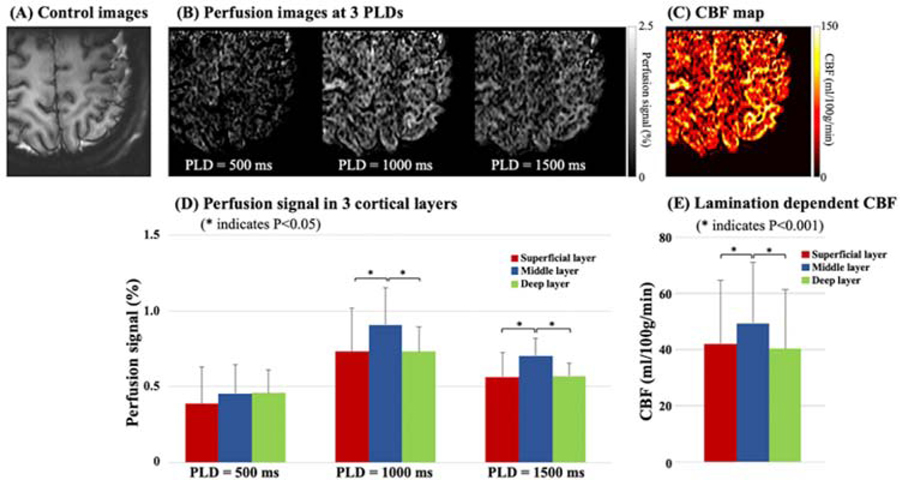
Figure 5.
Multi-delay perfusion images (B) and CBF maps (C) with sub-millimeter in-plane resolution (0.5 mm, after interpolation) acquired at 7T. (A) shows the corresponding structural control images. Small FOV was acquired using inner-volume 3D GRASE readout to shorten the acquisition time and increase SNR. (D) shows the bar plot of perfusion signal (normalized by M0) at PLD = 500, 1000, and 1500 ms in three layers of motor cortex. Multi-delay perfusion images reveal the dynamic passage of labeled signals, and the majority of labeled spins arrive into capillary space at PLD = 1000 ms. Perfusion signal in the middle layer is significantly higher (~20%) than the superficial or deep layer at PLD = 1000 and 1500 ms. (E) shows the bar plot of CBF, which was computed by a weighted-delay approach. CBF in the middle layer is 17.3% higher than the superficial layer and 22.7% higher than the deep layer.

