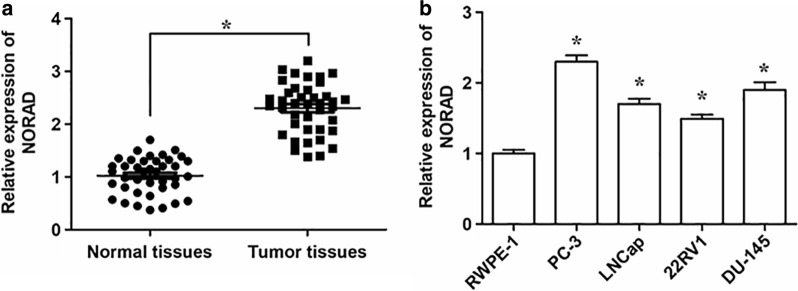
Fig. 1.
The expression level of LncRNA NORAD in PC tumor tissues and cell lines. a The relative expression levels of NORAD in PC tissues (Tumor tissues, n = 45) and adjacent normal tissues (Normal tissues, n = 45) determined by qRT-PCR. b Relative expression of NORAD was detected by qRT-PCR in PC cell lines (PC-3, LNCap, 22RV1, DU-145). The normal human prostate epithelial cell line (RWPE-1) served as a control. n = 3. The data were presented as the mean ± standard error of mean (SEM) and Student’s t-test was used for the comparison between 2 groups. *P < 0.05

