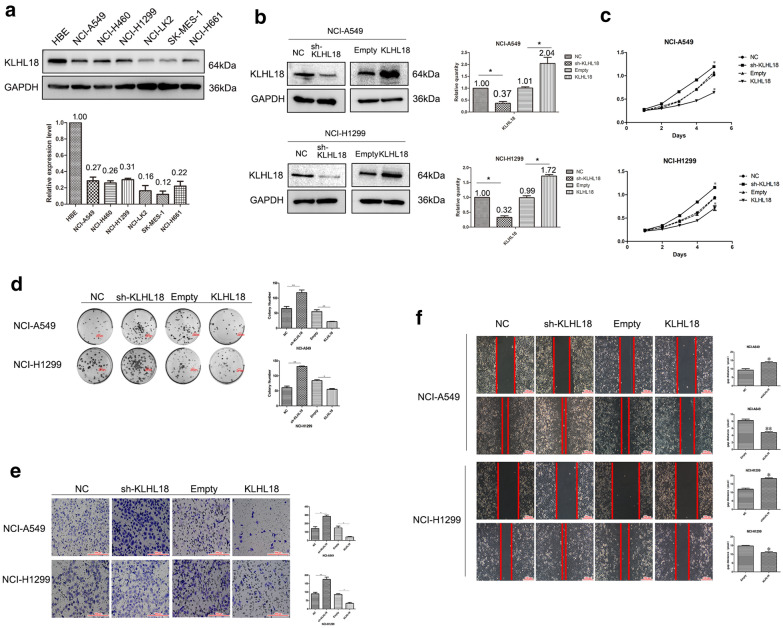
Fig. 2.
Silencing KLHL18 promotes proliferation, migration, and invasion of non-small cell lung cancer (NSCLC) cells. a Proteins were extracted from one bronchial epithelial and six NSCLC cell lines to determine the KLHL18 expression level. The lower panel shows the statistical analysis of KLHL18 expression in various cell lines. b The knockdown and overexpression efficiency of KLHL18 in lung cancer NCI-A549 cells and NCI-H1299 cells. The histogram on the right is a statistical graph of its gray value, *P < 0.05, **P < 0.01. c MTS assay results of NCI-A549 cells transfected with KLHL18-shRNA and KLHL18-Flag plasmids, *P < 0.05, **P < 0.01. The upper graph is the MTS result of NCI-A549, the lower graph is the MTS result of NCI-H1299. d The top panel shows a colony formation assay using NCI-A549 cells transfected with KLHL18-shRNA and KLHL18-Flag plasmids, *P < 0.05, **P < 0.01, and the lower panel shows the same results of NCI-H1299 cells, *P < 0.05, **P < 0.01. The far-right panel shows a quantitative representation of the colony-forming ability of both cell lines. e Transwell assays using KLHL18-expressing NCI-A549 and NCI-H1299 cell lines. The right-most panel shows KLHL18 in both cell lines. The graph shows a representation of the number of cells passing through the Matrigel, *P < 0.05, **P < 0.01. f Wound-healing assay showing the KLHL18 effect on the NCI-A549 and NCI-H1299 cell migration. The right panel shows the migration distance of the cancer cells, *P < 0.05, **P < 0.01

