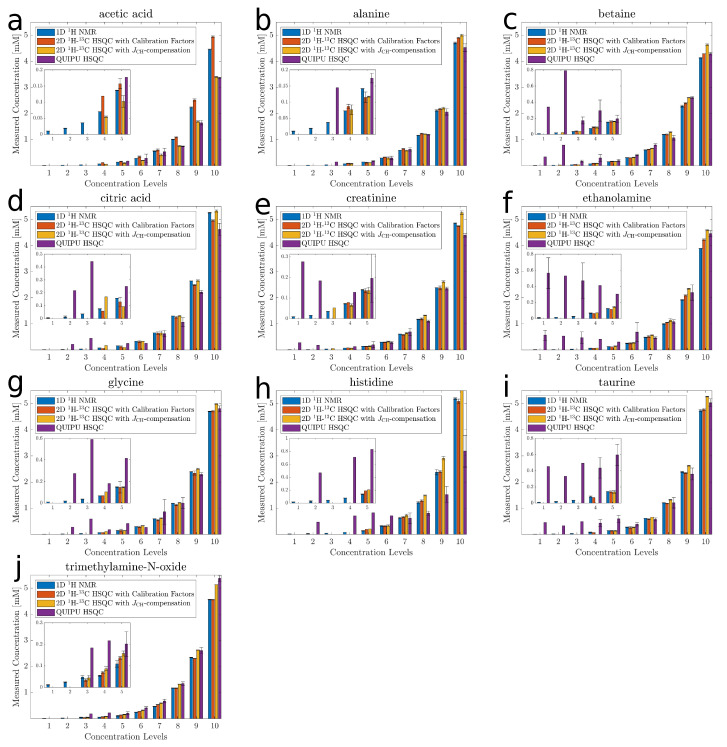
Figure 2.
Comparison of concentration estimates for acetic acid (a), alanine (b), betaine (c), citric acid (d), creatinine (e), ethanolamine (f), glycine (g), histidine (h), taurine (i), and trimethylamine-N-oxide (j). The x-axis shows the ten concentration levels and the y-axis the observed concentrations with 1D H NMR in blue, standard HSQC in red, Q-HSQC in orange and QUIPU-HSQC in purple. The lower five concentration levels are added as inserts. The concentration values are means over technical triplicates. In the case that the compound was detected in all three replicates, the corresponding standard deviation is included as a measure of error.

