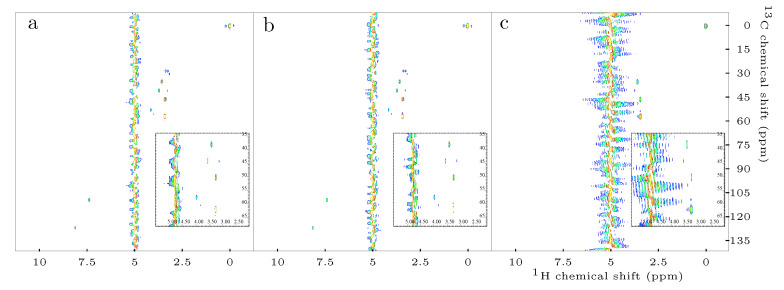
Figure 3.
Exemplary 2D H-C-HSQC spectra obtained by means of: standard HSQC (a); Q-HSQC (b); and QUIPU-HSQC (c). Inserts depict the spectral regions of 70.0–35.0 and 5.5–2.0 ppm. A considerable number of signals stemming from aliphatic protons of the investigated metabolites is located in this region. Furthermore, the residual water signal at 4.78 ppm is located in this region, thus frequent overlap is present.

