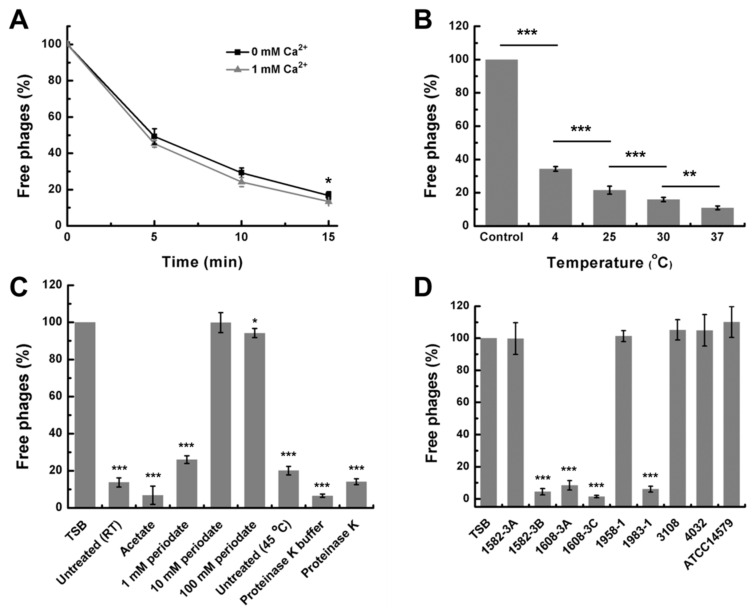
Figure 9.
Adsorption assay of DLc1. (A) Amount of adsorption during 15 min using 1582-3B as the host at 37 °C; (B) Adsorption of DLc1 to 1582-3B at different temperatures for 15 min; (C) Adsorption of DLc1 to 1582-3B after different treatments on the host cells (statistical significance is done by comparing the value of each group with the TSB group); (D) Adsorption of DLc1 to different strains (statistical significance is done by comparing the value of each group with the TSB group). (C) and (D) were both conducted at 37 °C for 15 min. All data present the means and standard deviations (SD) of three independent assays. Asterisks indicate significant differences (* p ≤ 0.05, ** p ≤ 0.01, and *** p ≤ 0.001).

