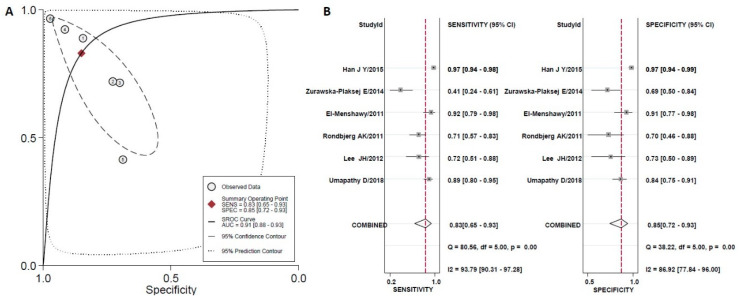
Figure 3.
(A) The hierarchical Summary Receiver Operating Characteristic curve of YKL-40 to discriminate controls (healthy individuals) from normoalbuminuric T2DM patients. The straight line represents the hSROC curve; the circle represents each of the analyzed studies; the diamond shape represents the point estimate to which overall sensitivity and specificity correspond. (B) Forest plot for sensitivity and specificity.

