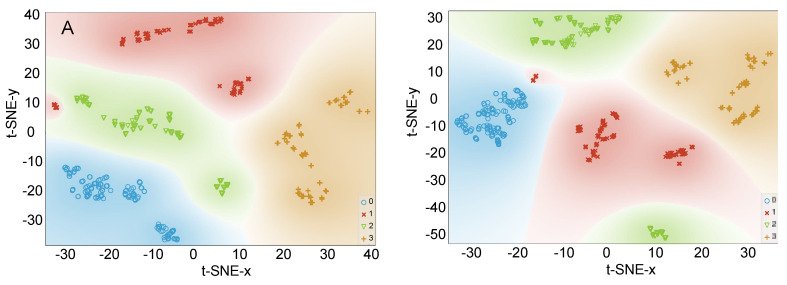
Figure 4.
Scatterplot obtained after applying t-SNE to the whole dataset using (A): all the 17 features (B): only the 6 best features (16:0, 18:2n6c, 20:3n3 + 20:4n6, 14:0, 18:1n9 and 22:6n3); 0—Norway, Figure 1. Chile farmed, 2—Canada farmed, 3—Canada wild.

