Table 5.
Antimicrobial properties of the fruit/berry by-products.
| Samples | The Diameter of Inhibition Zones (DIZ) (mm) | |||||||||
|---|---|---|---|---|---|---|---|---|---|---|
| Pathogenic and Opportunistic Bacterial Strains | ||||||||||
| 1 | 2 | 3 | 4 | 5 | 6 | 7 | 8 | 9 | 10 | |
| Shepherd | n.d | 13.3 ± 0.4 b | n.d | n.d | n.d | n.d | n.d | 12.9 ± 0.4 a | n.d | n.d |
| Raspberries | n.d | n.d | 12.0 ± 0.4 | 15.5 ± 0.3 b | 14.4 ± 0.3 | 12.2 ± 0.2 | 10.5 ± 0.4 | 13.6 ± 0.3 b | n.d | 15.3 ± 0.1 c |
| Sea buckthorn | n.d | n.d | n.d | 14.3 ± 0.4 a | n.d | n.d | n.d | 15.4 ± 0.2 c | n.d | 13.4 ± 0.2 b |
| Blueberries | n.d | 9.2 ± 0.2 a | n.d | 14.2 ± 0.1 a | n.d | n.d | 10.7 ± 0.21 | 12.4 ± 0.3 a | n.d | 12.3 ± 0.4 a |
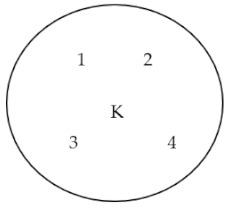
| Experiment Design | ||||||||||

|

|

|

|
|||||||
|
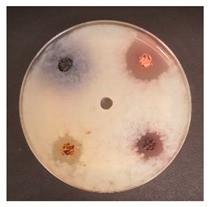
Bacillus pseudomycoides LT 104 |
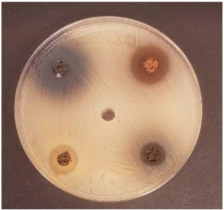
Acinetobacter johnsonii LT 110 |
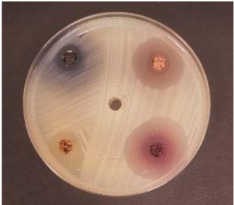
Cronobacter sakazakii LT 106 |
|||||||
1—Salmonella enterica Infantis LT 101; 2—Staphylococcus aureus LT 102; 3, E. coli (hemolytic) LT 103; 4—Bacillus pseudomycoides LT 104; 5—Aeromonas veronii LT 105; 6—Cronobacter sakazakii LT 106; 7—Hafnia alvei LT 107; 8—Enterococcus durans LT 108; 9—Kluyvera cryocrescens LT 109; 10—Acinetobacter johnsonii LT 110. The data expressed as mean values (n = 3) ± SD; SD, standard deviation. a–c The mean values within a column with different letters are significantly different (p ≤ 0.05); n.d, not determined.
