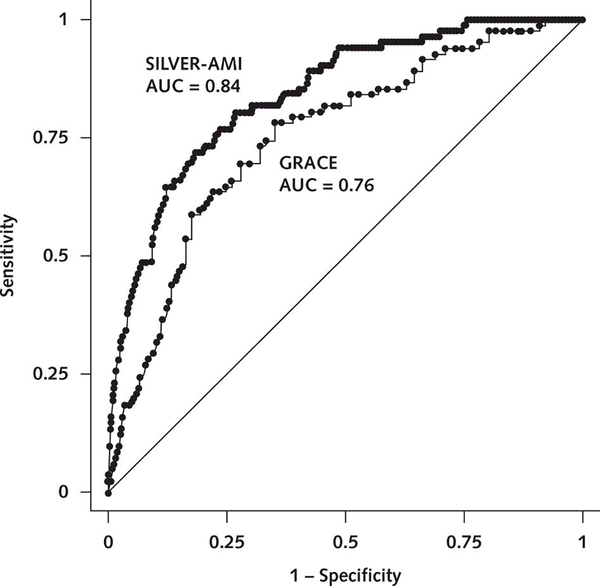
Figure 1.
Receiver-operating characteristic curves for the SILVER-AMI and GRACE mortality risk models. In our validation cohort, we compared the AUCs for the SILVER-AMI 6-month mortality risk model and the GRACE risk model (which was previously developed for post-AMI 6-month mortality). The GRACE risk model includes the following factors: age, development (or history) of heart failure, peripheral vascular disease, systolic blood pressure, Killip class, initial serum creatinine concentration, elevated initial cardiac markers, cardiac arrest on admission, and ST-segment deviation. The diagonal green line indicates 50% discrimination and is provided to show how much each model improves on purely random assignment of risk. As shown, the SILVER-AMI mortality risk model showed superior discrimination compared with the GRACE model (AUC = 0.84 vs. 0.76; P < 0.001). AMI = acute myocardial infarction; AUC = area under the curve; GRACE = Global Registry of Acute Coronary Events; SILVER-AMI = Comprehensive Evaluation of Risk in Older Adults with AMI.

