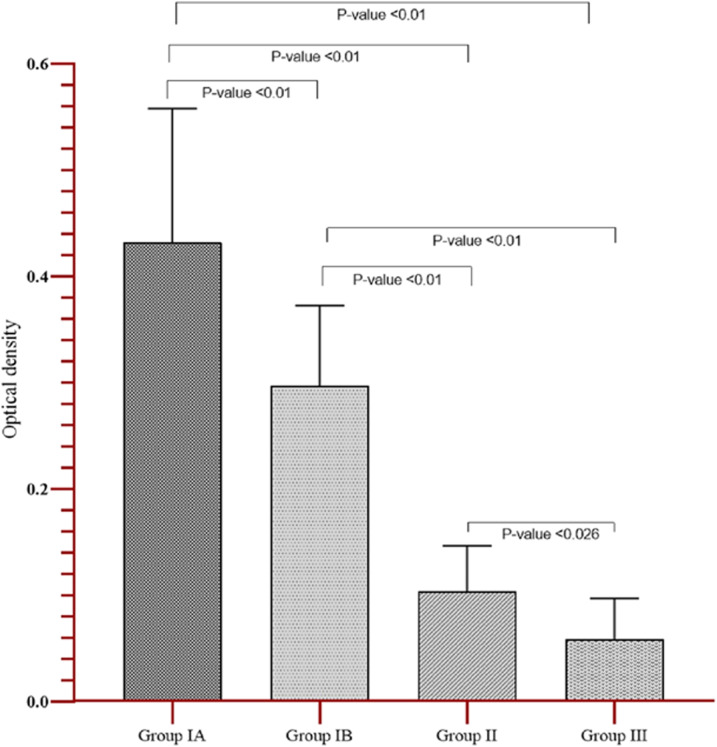
Figure 1.
One-way ANOVA comparison of the optical density (OD) values (mean + 1 SD) of the different serum groups. Group 1A: positive by Strongyloides IgG-ELISA and IgG4 rapid test, and stool samples were positive by microscopy and/or PCR (n = 20); group 1B: negative by Strongyloides IgG-ELISA and IgG4 rapid test, but stool samples were PCR positive (n = 11); group II: infected with other parasites and negative by Strongyloides IgG-ELISA (n = 73); group III: healthy donors who were negative by Strongyloides IgG-ELISA (n = 22). This figure appears in color at www.ajtmh.org.

