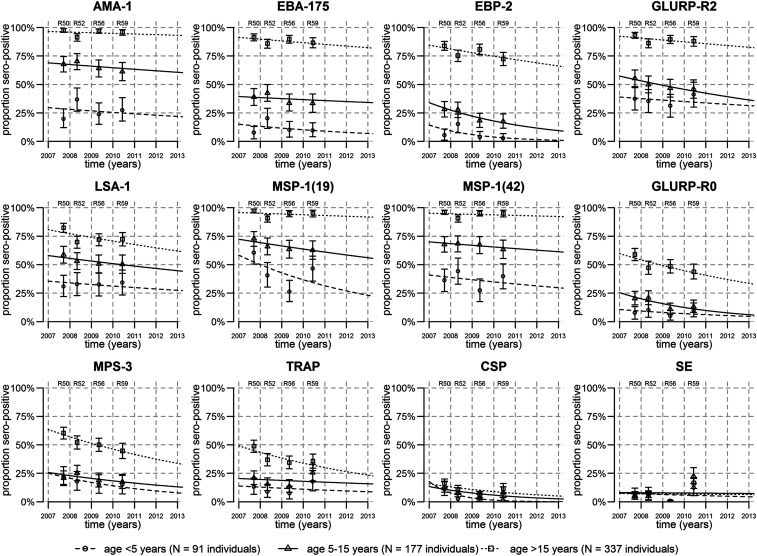
Figure 2.
Waning of seroprevalence overtime. In 4 cross-sectional cohorts with repeatedly sampled individuals, seroprevalence to 12 Plasmodium falciparum antigens reduced overtime. Points represent the proportion seropositive in three age-groups from each of the four cross sections, with 95% CIs represented by vertical bars. Lines represent the fit of models of waning seroprevalence.

