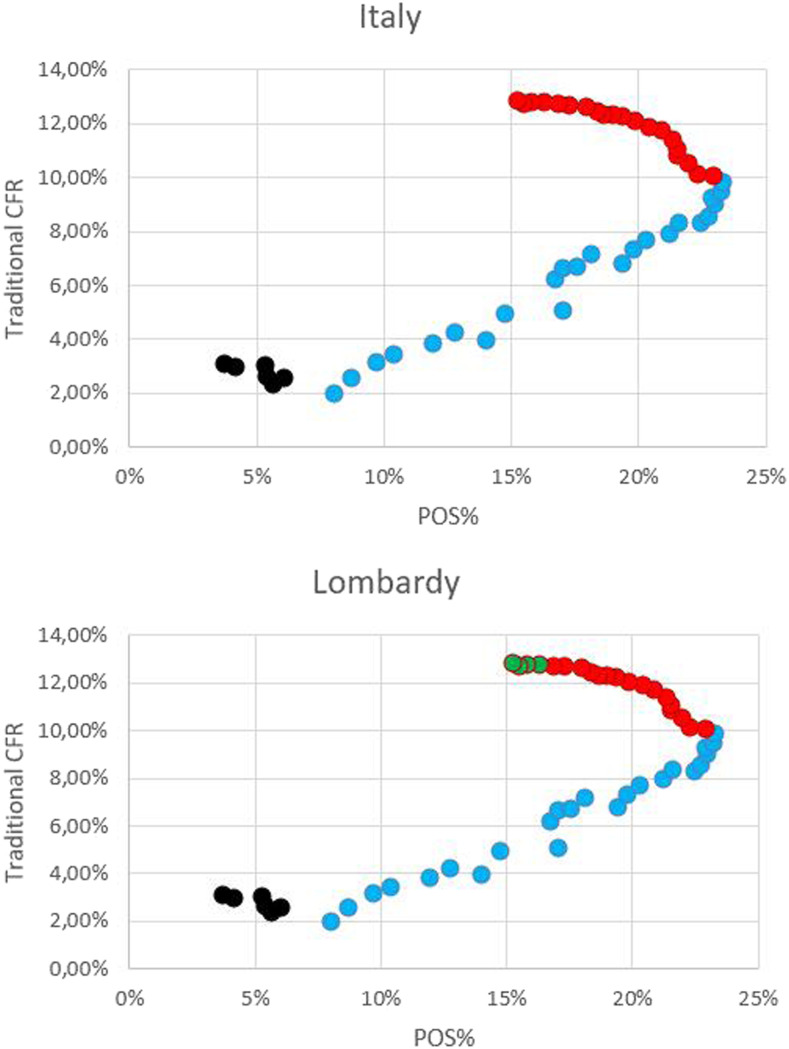
Figure 5.
Correlation between the percentage of positive results among performed tests (POS%) and case fatality rate (CFR) during the 2020 COVID-19 outbreak in Italy and Lombardy. (A) Correlation between POS% and CFRa, based on Italian data. (B) Correlation between POS% and CFRa, based on data from Lombardy. Black dots: data from February 24 to February 29. Blue dots: March 1–24. Red dots: March 25–April 13. Green dots: April 10–13 (only data from Lombardy). aCase fatality rate is calculated by dividing the number of deaths in patients who tested positive for COVID-19 by the cumulative number of cases at a specific point in time.

