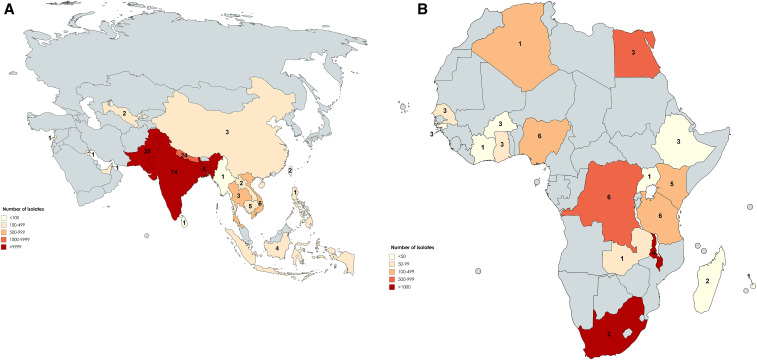
Figure 2.
(A) Number of study sites and isolates tested by country in the Asia region, 1972–2018 (created with MapChart). Number for each country denotes the number of study sites that reported data for Salmonella Typhi resistance. (B) Number of study sites and isolates tested by country in the Africa region, 1972–2018 (created with MapChart). Number for each country denotes the number of study sites that reported data for Salmonella Typhi resistance.

