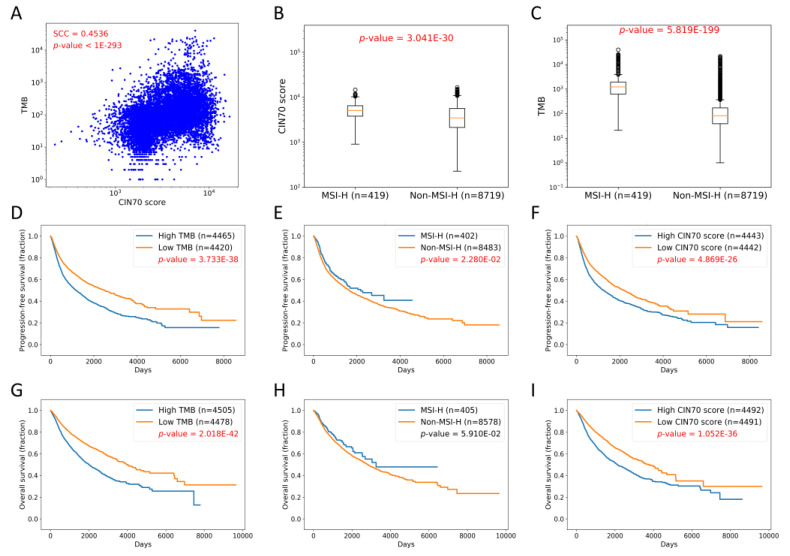
Figure 2.
Pan-cancer data analysis. (A) Correlation between CIN70 and TMB (SCC = 0.4536, p-value < 1.0 × 10−293). (B) Association between CIN70 and MSI status (p-value = 3.041 × 10⁻³⁰, Mann–Whitney U test). (C) Association between TMB and MSI status (p-value = 5.819 × 10−199, Mann–Whitney U test). (D) Association between TMB and progression-free survival (PFS) (p-value = 3.733 × 10−38, log-rank test). (E) Association between MSI status and PFS (p-value = 0.0228, log-rank test). (F) Association between CIN70 and PFS (p-value = 4.869 × 10⁻²⁶, log-rank test). (G) Association between TMB and overall survival (OS) (p-value = 2.018 × 10−42, log-rank test). (H) Association between MSI status and OS (p-value = 0.0591, log-rank test). (I) Association between CIN70 and OS (p-value = 1.052 × 10−36, log-rank test).

