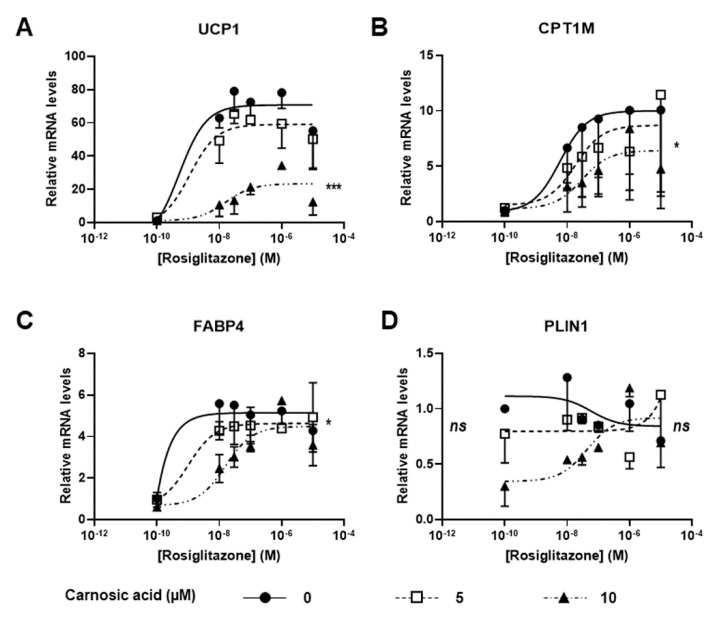
Figure 3.
Efficiency of CA against rosiglitazone: conversion into brite adipocytes of white hMADS adipocytes was induced (between days 14 and 18) in the presence of varying amounts of rosiglitazone (10 nM–10 µM) in the absence (●) or the presence of 5 (□) or 10 (▲) µM CA. mRNA levels of thermogenic (UCP1 and CPT1M (A,B)) and adipogenic (FABP4, PLIN1, (C,D)) markers were analyzed. Each point on the curves represents mean ± SEM of two independent experiments (two replicates for each experiments); one-way ANOVA followed by Tukey post hoc test, the untreated vs. CA 10 µM-treated condition: *, adjusted p < 0.05; ***, adjusted p < 0.01.

