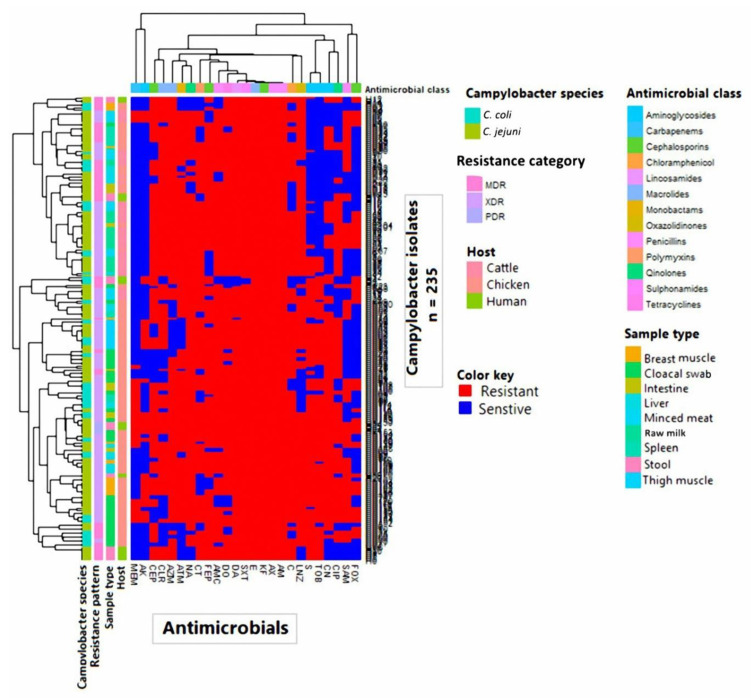
Figure 1.
Overall distribution and clustering of Campylobacter isolates (n = 235) under study and the patterns of their antimicrobial resistance. Different Campylobacter species, hosts, sample types, antimicrobial classes, and resistance categories are shown for each isolate as color codes. The heat map represents the hierarchical clustering of the isolates and the antimicrobial classes.

