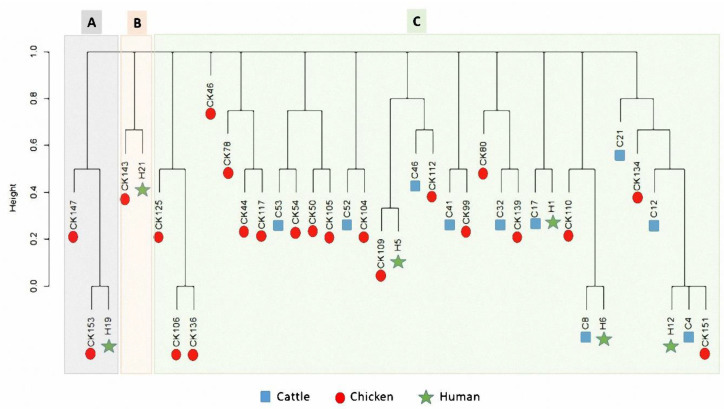
Figure 3.
Dendrogram showing the binary distances among different Campylobacter isolates based on the integron patterns. The isolates are categorized based on their host, which are shown as different colors and symbols. The X-axis refers to the binary distance scale. Isolates codes are illustrated in Table 4.

